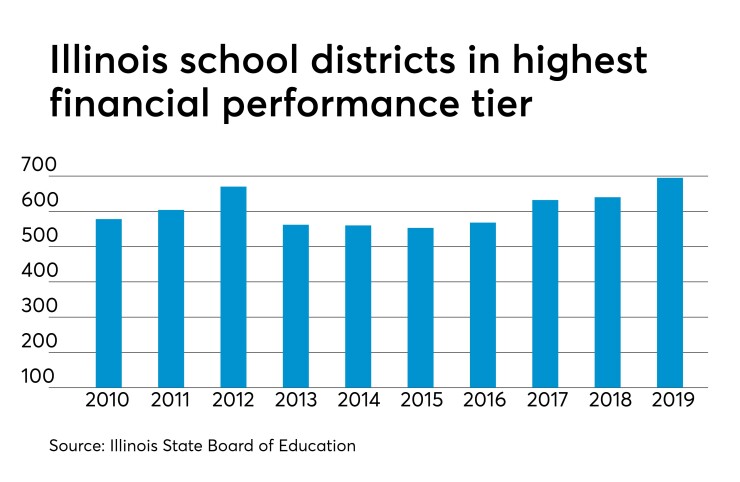
New state aid and another year of improving property tax values lifted more Illinois school districts into the state’s top fiscal performance category.
A total of 695 districts, or 81.7% of the 851 reporting, made the top category of financial recognition, up from 640 or 75.1% the previous year when 852 districts were included in the report, according to the

The number of districts landing in the financial review category declined to 111 or 13%, compared to 147 or 17.3% of districts last year.
The number of districts that fell into the weakest two categories also slid with those landing in financial early warning totaling 33, compared to 43 last year. The number in the lowest category of financial watch totaled 12, or 1.4%, compared to 22, or 2.6% the previous year.
The state's largest district, Chicago Public Schools, moved up to financial early warning from financial watch.
“The 2019 Financial Profile overall scores have improved substantially over the past years,” with the results reflecting “positive results for fiscal solvency due to increased equalized assessed valuations, increased state revenue, maintained expenditures, and less reliance on debt,” says the fiscal report card.
Notably, the report adds that positive results were also influenced by the late distribution of $366 million in state funds during the last quarter in fiscal 2018.
The increased valuations translate into higher tax levy collections that have boosted districts’ local revenue sources. They saw an overall increase of $484.4 million or 2.97% over fiscal 2017.
District balance sheets benefited from a $1.2 billion hike, an increase of 19.3%, in state revenue following the 2017 overhaul in school funding that shifted general aid to an evidence-based formula model.
The fiscal 2019 increase totals $168.8 million. That will be reflected in next year’s profile.
The report also showed districts are less reliant on issuing debt to meet operational needs. Districts issued $347.1 million in long-term debt that fell into the operational funds category compared to $369.4 million in 2017. Of the $347.1 million, $311.9 million was for working cash.
The financial profile report card has been issued for 16 years to evaluate district finances. It is presented to the state board, which in turn approves the designations.
Districts fall into four categories based on a scoring system that evaluates five financial metrics including a district’s fund balance-to-revenue ratio, expenditure-to-revenue ratio, days cash on hand, and the percentage of remaining short-term and long-term borrowing ability.
Districts on the financial early warning and financial watch lists must submit additional quarterly financial information to the state.
“Agency staff will continue to review and monitor school districts on the financial review and watch lists, provide technical assistance to districts in need, and recommend potential certification of districts to the board,” which allows for state intervention, the report said.
The report also highlights the difficulties of balancing fiscal operations with academic needs.
“It is possible that fiscal solvency achievements have come at the expense of academic achievements for students,” says the report. “More than 77 % of school districts are still operating at less than 90% of financial capacity to meet expectations, which means many students are still being denied opportunities they deserve.”
Trends began improving in the 2017 report due to rising property values, but the additional state aid provided another boost.
Previous reports had offered grim warnings that districts were “at a point where additional budget reductions are going to be very difficult” without damaging academics with late aid payments during the state’s budget impasse between 2015 and 2017 forcing districts to “make difficult choices of decreasing expenditures, incurring debt and/or eroding fund balances.”
Chicago Public Schools saw its score rise to 2.70. That moved it up into the second-lowest category, financial early warning, after four years in the weakest category, financial watch.
The district benefited from a combination of new state aid support, local support, and expense cuts.
Metrics that helped the district included its turnaround to a positive ending balance of $342 million in fiscal 2018 from a negative $270 million balance in 2017. The debt ranking, however, declined due to high borrowing levels totaling $2.2 billion for restructuring and capital.
The district is receiving $300 million in new state aid from the revised school funding formula and to help cover its pension contributions. The state also gave the district an additional $130 million in tax levy capacity and the city provided $80 million to help cover public safety costs in 2018.
A negative operational fund balance for multiple years can trigger additional state intervention through a potential certification of financial difficulty.
CPS, however, is exempt from the most stringent oversight sanctions that a finding of “financial difficulty” can bring under the code, although it must submit information for review.


