-
Acacia and Estrada grew substantially.
 February 1
-
McCall Parkhurst & Horton and Norton Rose Fulbright moved up in 2020 to second and third.
February 1
-
The growth in issuance in 2020 spread out over the top 10 underwriters, with bulge-bracket firms sharing the wealth.
 January 6
-
The top municipal bond counsel firms easily surpassed 2019's pace of par amount. Year-to-date, the top-ranked firms have totaled $326.46 billion compared with last year's number of $265.99 billion.
 October 16
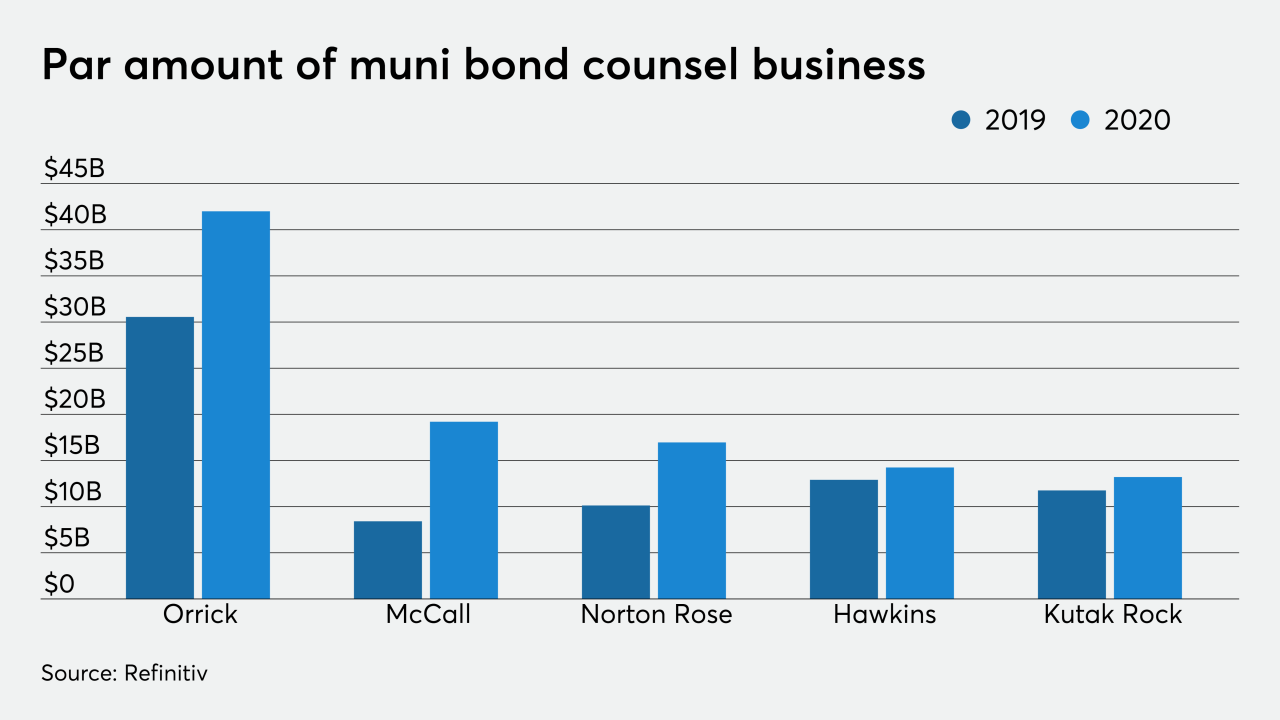
-
The two active municipal bond insurers wrapped $25.22 billion in the first three quarters of 2020, a 62% surge from the $15.57 billion of deals done in the first nine months of 2019.
October 16
-
Municipal bond issuers are coming market at a 26.2% faster pace than they were at this point last year.
October 8
-
Financial advisors in the municipal bond market accounted for $281.23 billion so far in 2020, more than the $225.54 billion in the first nine months of 2019. The top three spots remained the same, followed by some changes in the rankings from last year.
October 8
-
Municipal bond underwriters are on pace to easily surpass last year's total, despite the COVID-19 pandemic. Top bookrunners have accounted for a total of $328.60 billion through the first three quarters of the year, up from the $267.91 billion in the first nine months of 2019. The top five saw small changes compared to a year ago, while spots six through 10 saw more of a mix.
October 8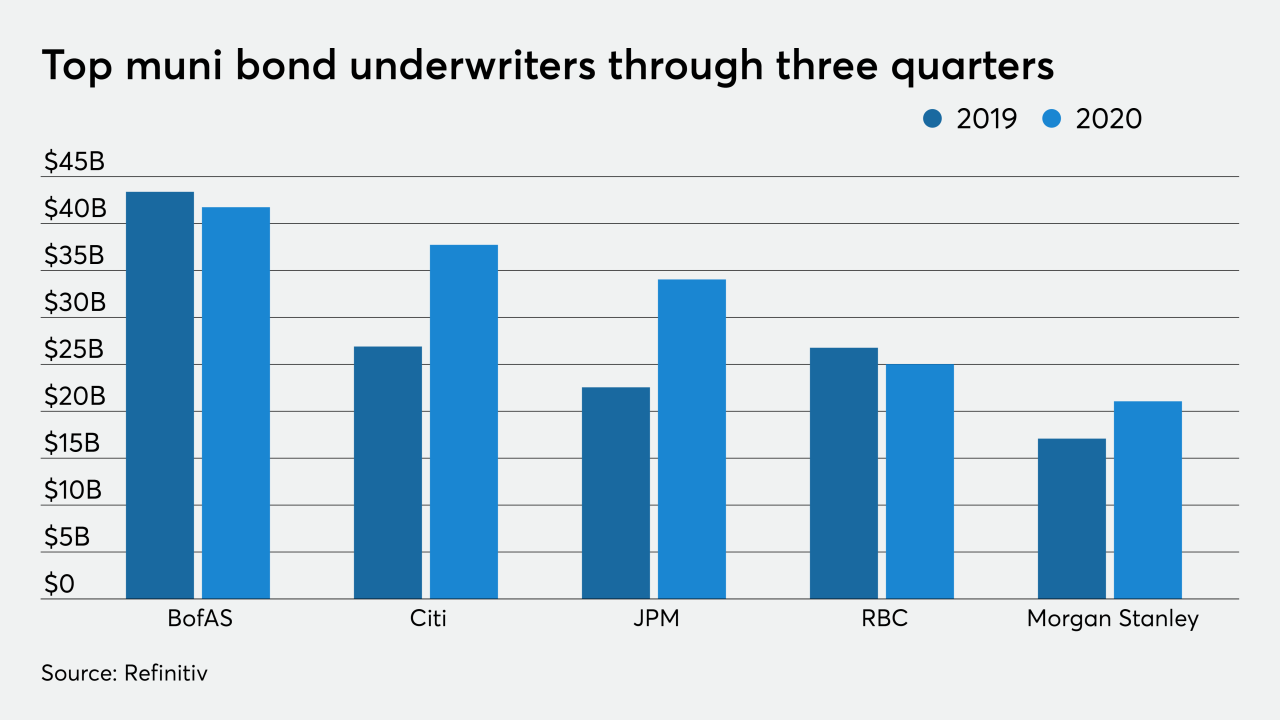
-
COVID-19 has put large burdens on state and local coffers and new business for the municipal bond insurers, generally, has increased.
July 15
-
There were a few changes in the top municipal bond counsel rankings, with the only spots staying the same numbers one and 10.
July 15
-
Despite the coronavirus wrecking havoc all over the world and with the brunt of the damage occurring in the second quarter of the year, municipal bond issuers have sold just over $23 billion more than they did at this time last year.
July 8
-
The top 10 saw three firms that were not in it last year and only one firm remained in the same position compared to the previous year's first six months.
July 8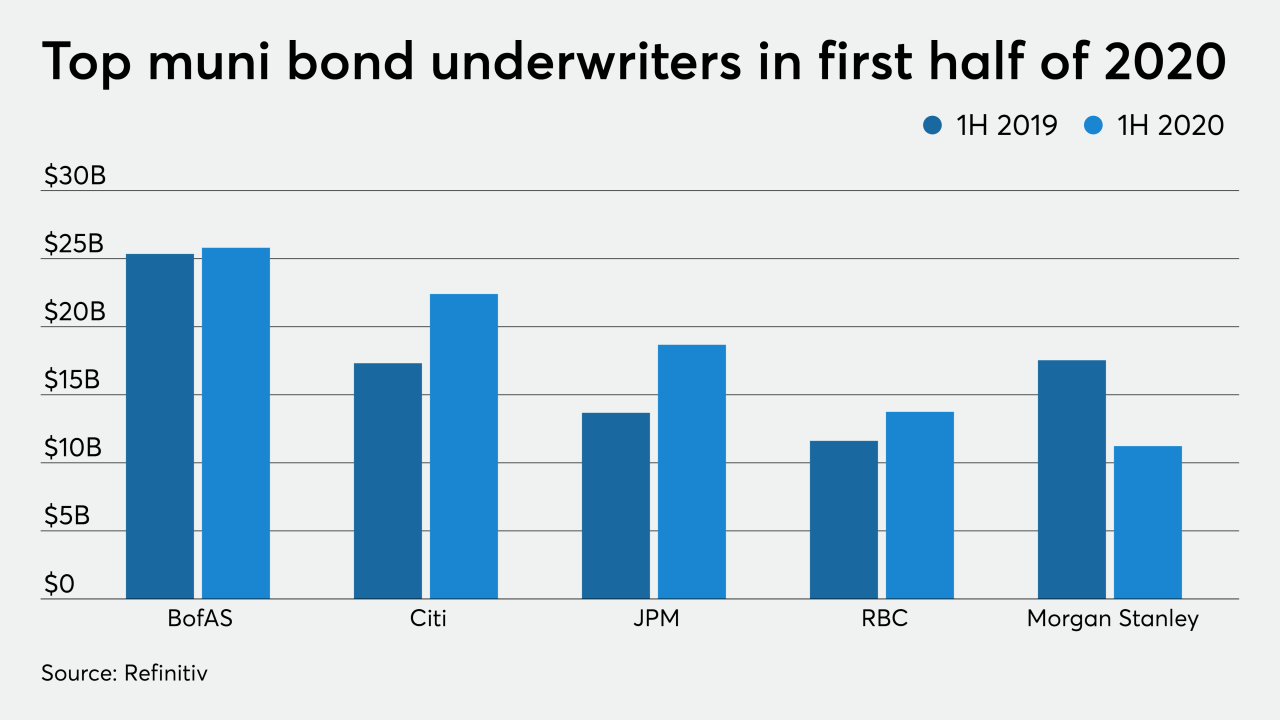
-
Financial advisors in the municipal bond market accounted for $159.85 billion so far in 2020, more than the $138.61 billion in the first six months of 2019. There was only one change in the top-five year-over-year.
July 8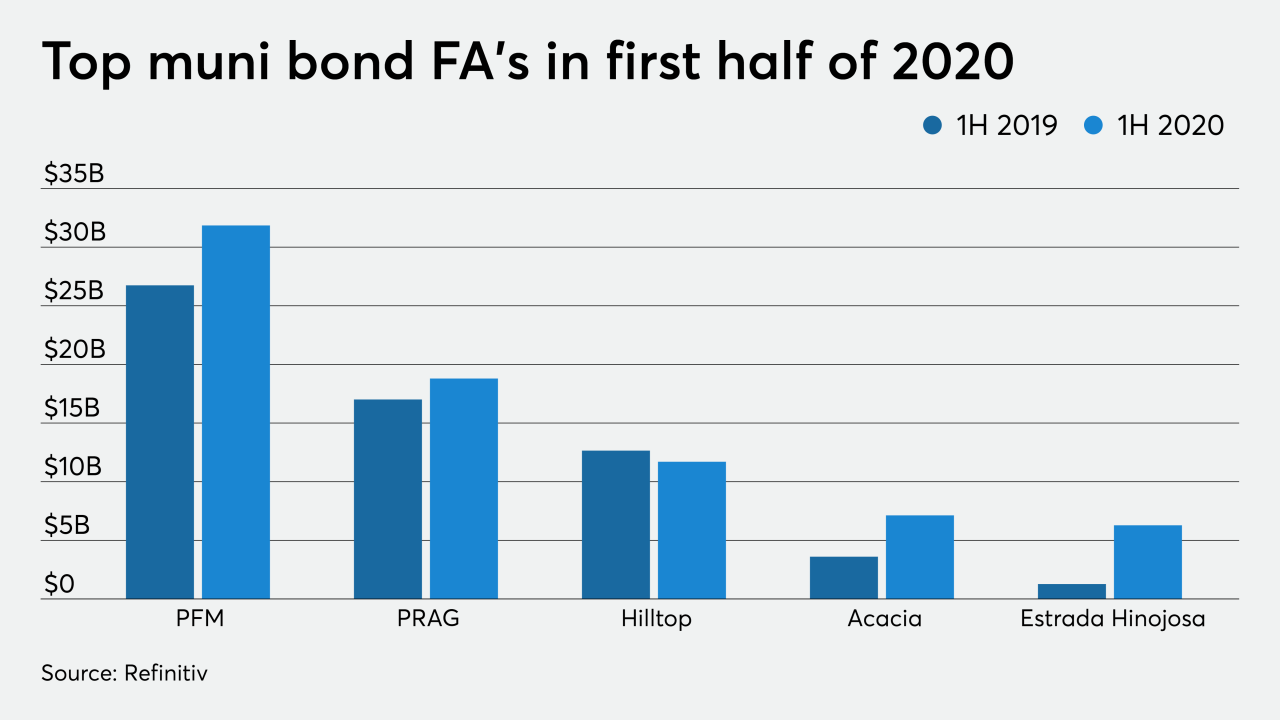
-
Municipal bond counsels accumulated $87.02 billion, up from the $75.14 billion in the first three months of 2019. The top spot remained the same but the rest of the top 10 saw a plethora of changes.
April 15
-
The two active municipal bond insurers insured $4.83 billion in the first quarter of 2020, an uptick from the $3.62 billion of wrapped deals done in the first three months of 2019. The year-over-year increase in the sector is noteworthy given that the primary market was shuttered for weeks in March due to the coronroavirus pandemic.
April 15
-
Financial advisors in the municipal bond market accumulated $74.48 billion, up from the $65.03 billion in the first three months of 2019. The top four places remained the same but the rest of the top 10 all saw big changes.
April 7
-
Despite a muted month of March due to the COVID-19 pandemic which included two weeks of no negotiated deals, muni bond issuers still sold more long-term debt than they did during the first three months of 2019. Issuers accounted for a total of $84.87 billion of bonds throughout 2,119 transactions, compared to $75.84 billion in 1,809 deals in first quarter of 2019. The top 10 features five newcomers from a year ago, including the top spot.
April 7
-
Underwriters of municipal bonds did the majority of business during the first two months of the year, before COVID-19 swept the country with sickness and severe spreading. The top underwriters accounted for $87.84 billion of bonds throughout 2,119 transactions, compared to $75.84 billion in 1,809 deals in first quarter of 2019.
April 7
-
Refundings and taxable deals were also up substantially, driving the region to $75 billion of municipal bond volume, up 32.6% from 2018.
February 26
-
The top municipal bond counsel saw $265.58 billion of business in the first three quarters of 2019, up from $237.49 billion a year earlier. Orrick Herrington & Sutcliffe LLP once again found itself on top with Hawkins Delafield and Wood gaining some ground.
January 21


