-
Data for the second quarter show the face amount of munis outstanding rose 0.4% quarter-over-quarter, or $15.5 billion, to $4.043 trillion.
 September 26
-
Despite this, August saw the largest monthly volume of 2023, helped by several billion-dollar deals and multiple Texas school district deals.
August 31
-
Municipal bond issuance in the Far West was down 2.3% in a first half that saw volume drop 17.1% nationally.
 August 24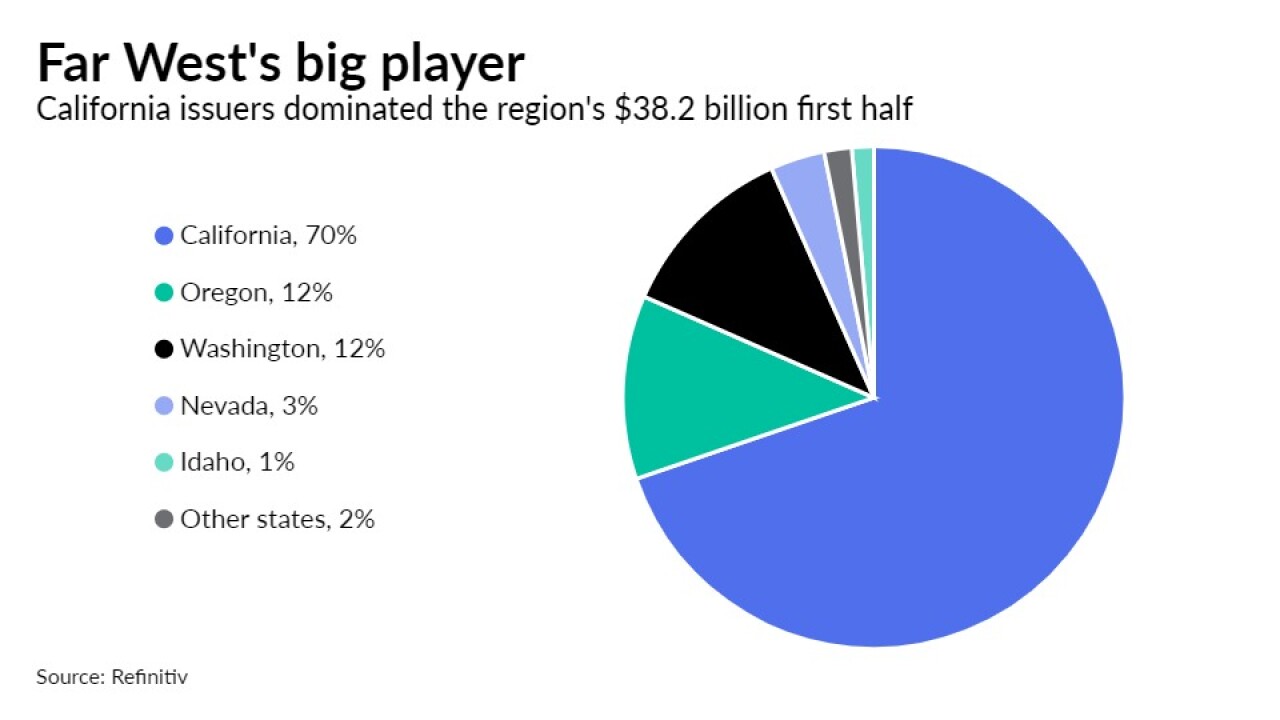
-
The region's issuers sold $30.3 billion of municipal bonds in the first half of 2023, 29.9% less than they did during the same period last year
 August 23
-
Healthcare and transportation had the biggest contraction in issuance volume.
 August 21
-
Total volume in the first half of the year was $180.882 billion in 3,853 deals, down 17.1% from the $218.230 billion in 5,444 over the same period in 2022, according to Refinitiv data.
August 21
-
New York deals dominated the top ranks of regional issuers in the first half of 2023 even as supply sank around the Northeast and around the country.
 August 18
-
July's total volume was $25.939 billion in 542 issues, down from $28.258 billion in 619 issues a year earlier, the smallest percentage drop in monthly issuance year-over-year in 2023, according to Refinitiv data.
July 31
-
Total volume for the month was $34.436 billion in 744 issues, down from $37.775 billion in 984 issues a year earlier, according to Refinitiv data.
June 30
-
Market participants agree issuance will not hit the highs seen in 2020 and 2021, but they are split on whether issuance will surpass the $384.086 billion of debt issued in 2022.
June 20
-
Federal Reserve data shows that retail ownership of municipals rose $58.8 billion, or 3.7% quarter-over-quarter, to $1.67 trillion. Bank ownership fell in the first quarter by $13.3 billion.
June 12
-
Total volume for the month was $26.062 billion in 677 issues, down from $36.583 billion in 928 issues a year earlier, according to Refinitiv data.
May 31
-
Total volume for the month was $30.599 billion in 577 issues, down from $40.423 billion in 900 issues a year earlier. Total issuance year-to-date is at $107.626 billion, falling 25.2% from the same period of 2022.
April 28
-
Household and U.S. bank ownership of individual bonds fell and the total face amount of munis outstanding was down 0.6% quarter-over-quarter and down 1.4% year-over-year, Fed data shows.
April 10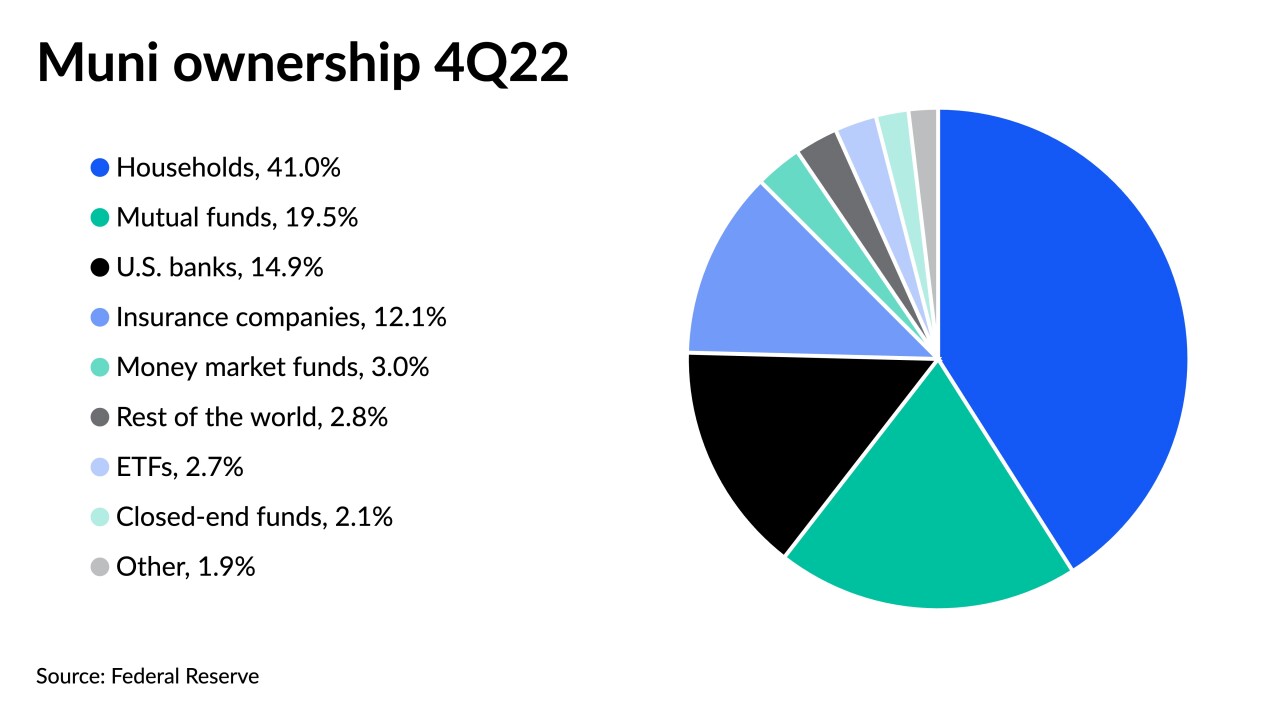
-
Total volume for the month was $31.795 billion in 515 issues, down from $45.555 billion in 985 issues a year earlier, according to Refinitiv data.
March 31
-
Total volume for the month was $18.303 billion in 391 issues versus $31.602 billion in 877 issues a year earlier, according to Refinitiv data.
February 28
-
A substantial drop in new money volume sets California and the Far West apart from the the country.
February 16
-
Spending on climate proofing infrastructure and other green capital developments increased 68% while overall volume tumbled 13% in the region.
February 15
-
Midwest borrowing last year went from 11% year-over-year growth in the first quarter to a 48% plunge in the fourth quarter.
 February 14
-
Rising interest rates depressed refunding opportunities, but new money issuance rose amid demand for infrastructure to serve the region's growing population.
 February 13


