-
Issuance was $55.454 billion in 784 deals, up 13.7% year-over-year from $48.754 billion across 802 transactions. This is the highest monthly total for September, according to LSEG.
 October 1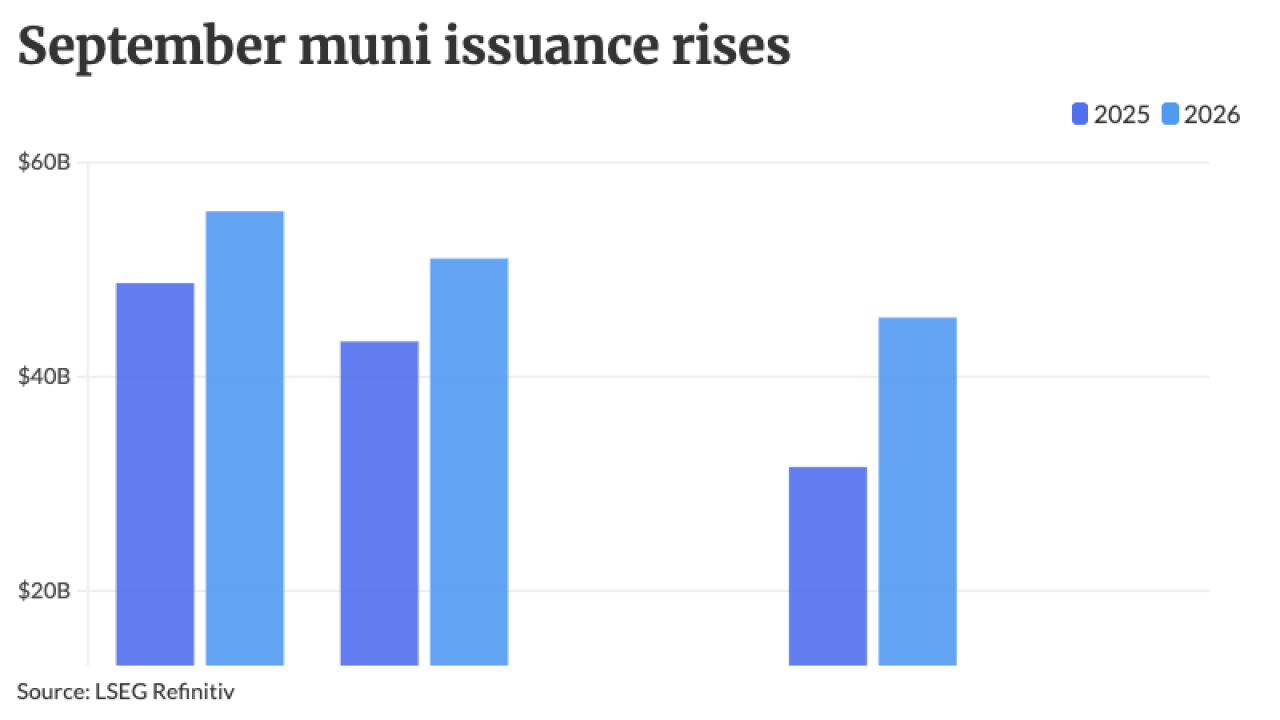
-
"The reason the number [of trade counts] is a record and not just elevated is structural, and it's been building for years," said Josh Rosenblum, head of municipal trading strategies at Brownstone.
September 4
-
Heavy August issuance created fewer oversubscriptions and more demand for concessions, a signal that issuers, advisors and underwriters need to pay closer attention to structure, timing and clearing levels, according to Market Intelligence analyst Jeff Lipton.
September 3 The Bond Buyer
 -
Issuance was $59.57 billion in 873 deals, up 14.5% year-over-year from $52.006 billion across 880 transactions.
September 1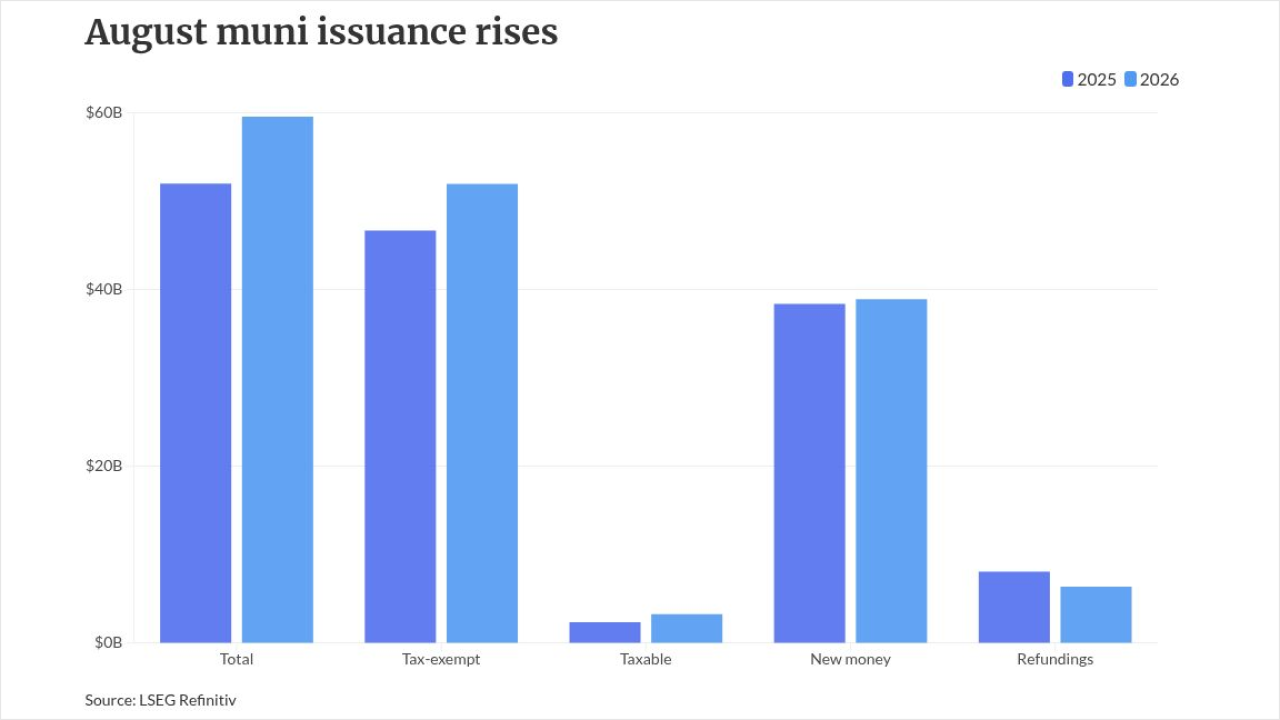
-
California's fall issuance plans bring a big name into the market at a time when high muni issuance levels have withstood higher interest rates.
August 28
-
Municipal bond volume currently stands at $372.991 billion in 2026, up only 0.8% from $370.022 billion at the same time last year.
August 19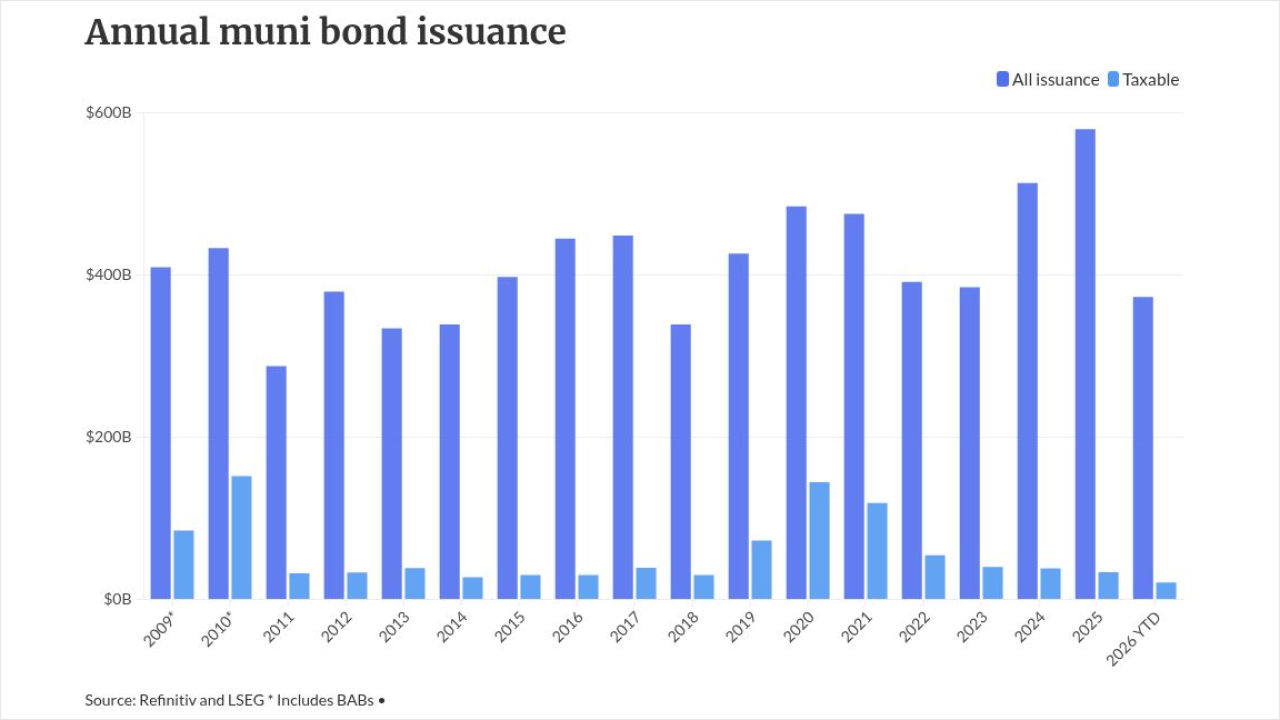
-
The muni market produced $294.884 billion of debt issuance in the first half of 2026, up 5.8% from the previous record of $278.694 billion in the first half of 2025, according to LSEG data.
August 17
-
Issuance was $44.928 billion in 694 deals, down 19.8% year-over-year from $56.055 billion across 860 transactions.
August 3
-
Municipal issuers sold $299.293 billion of bonds in the first half of 2026, up 5.2% year-over-year, according to LSEG data.
July 1
-
Market Intelligence analyst Jeff Lipton recaps May's muni outperformance versus Treasuries and broad fixed income, highlighting how carry, reinvestment demand and spread compression drove strong returns and helped A3 and Baa credits lead the market.
June 5The Bond Buyer -
Primary market muni supply year-to-date is at $235.028 billion, up 4.3% year-over-year, according to LSEG.
June 1
-
As SMAs have garnered attention, they shifted demand further down the yield curve into one- to five- or one- to 10-year area, though SMAs go out 15 or 20 years.
May 13
-
Municipal bond issuance was $47.6 billion in 797 deals for the month, down 7.8% year-over-year but still the third-biggest April in history.
May 1
-
Issuance was $50.081 billion in 697 issues, up 17.3% year-over-year from $42.709 billion across 726 transactions.
April 1
-
"The secondary infrastructure demands [of data centers] will increasingly flow through to municipal balance sheets, driving incremental issuance across multiple sectors," said J.P. Morgan strategists.
March 23
-
Issuance was $40.336 billion in 632 issues, down only 1.1% year-over-year from $40.772 billion across 731 transactions.
March 2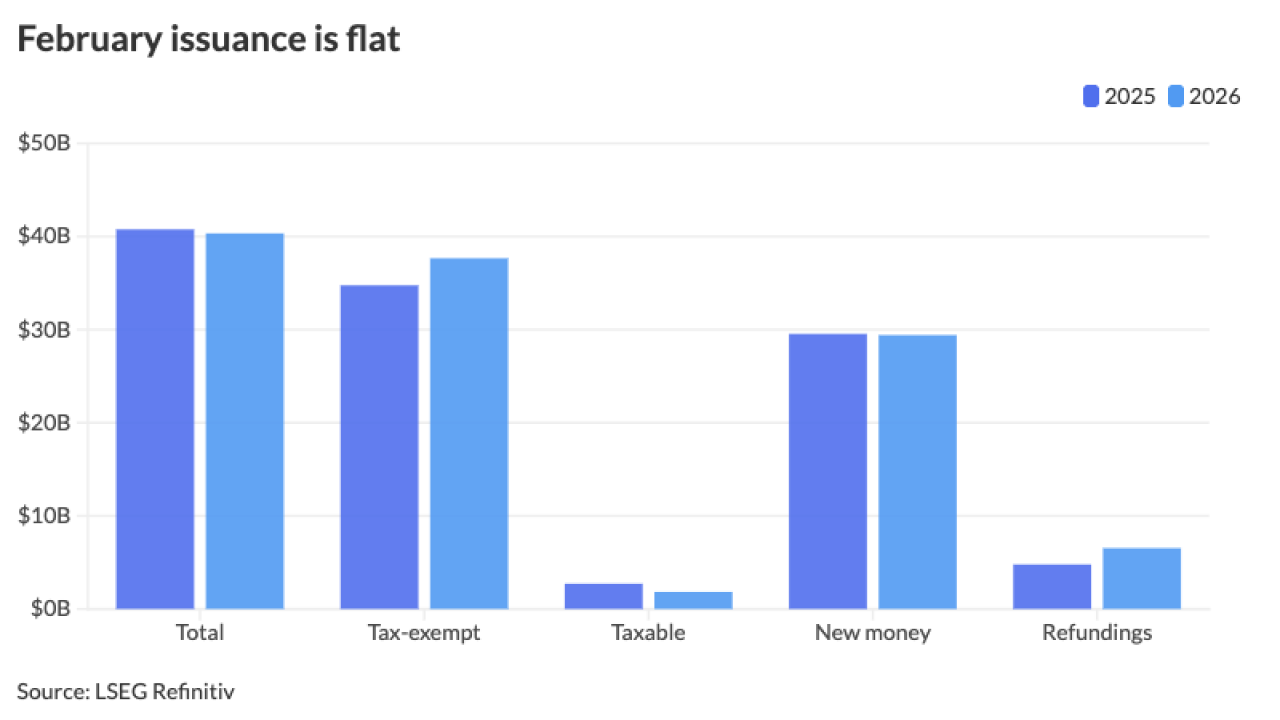
-
Environmental facilities and public facilities were the sectors that saw the biggest percentage declines.
 February 17
-
The muni market produced $586.195 billion of debt issuance in 2025, up 14.1% from the previous record of $513.652 billion in 2024, according to LSEG data.
February 17
-
Bonding should increase in the next few years to address aged state and local infrastructure, Moody's Vice President Dan Seymour said.
February 13
-
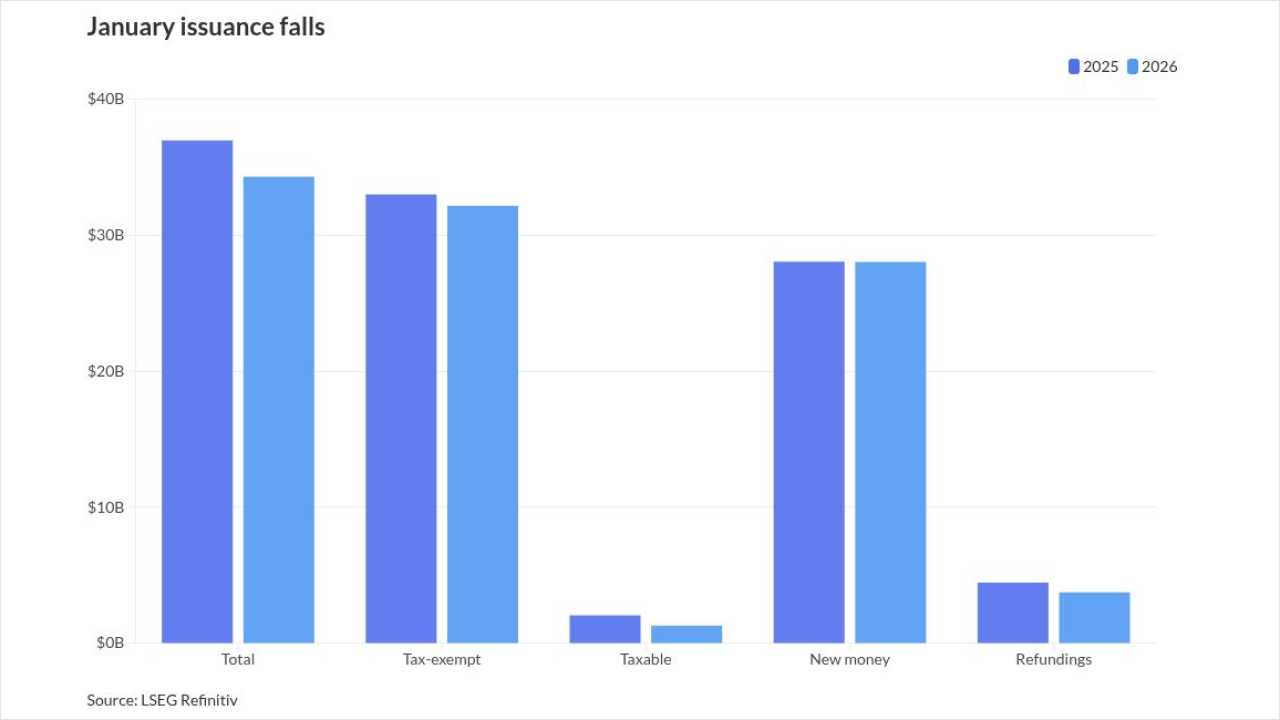
Issuance was $34.308 billion in 471 issues, down 7.2% year-over-year from $36.982 billion across 536 transactions in 2025. However, this was the third-highest monthly figure for January and above the month's 10-year average of $29.699 billion
February 2