Revised issuance figures for April show the month eked out gains year-over-year, as a heavy slate of issuance during the second half of the month, helped by several large deals on Wednesday, offset the tariff-induced volatility that led sales to be postponed or moved to the day-to-day calendar at the start of the month.
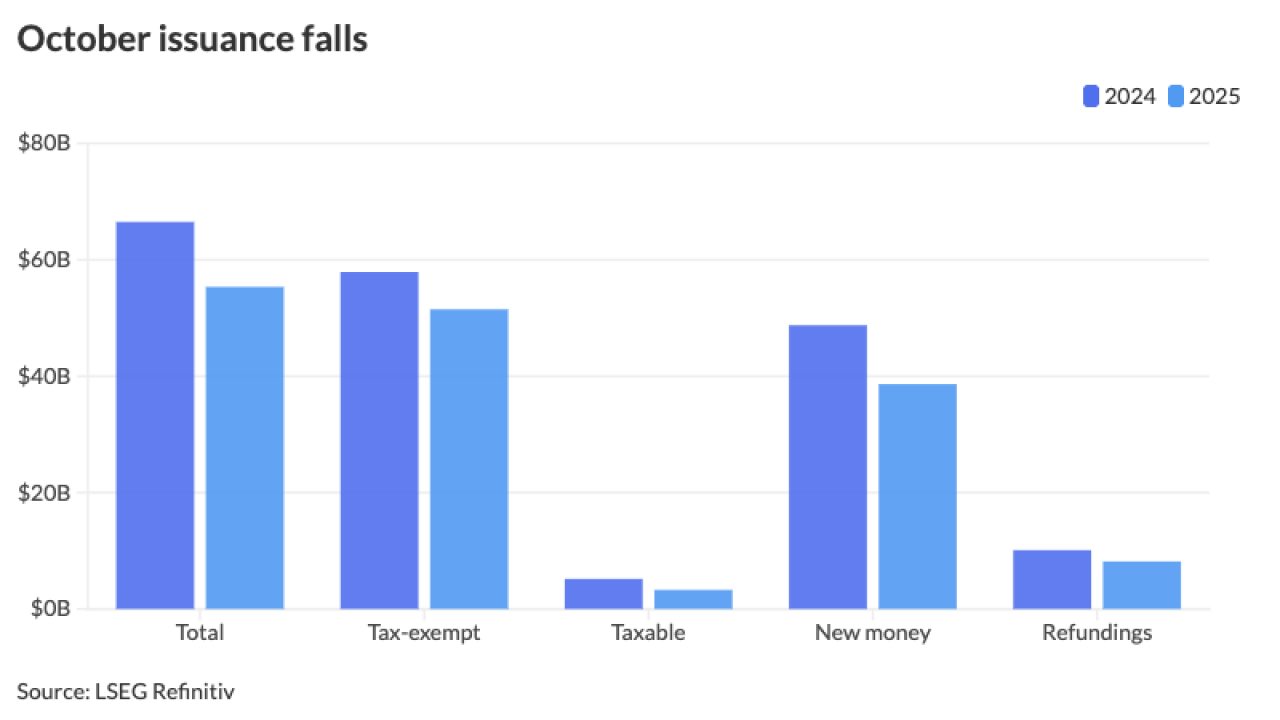
April's volume was revised upward to $45.825 billion in 727 issues, up 2% from $44.945 billion in 707 issues in the same period in 2024, according to revised LSEG data. Issuance year-to-date is up 11.5% at $165.66 billion.
Municipals from January through March were on an "upswing" as issuance rose every month year-over-year, said Giles Nicholson, senior managing director and head of the Public Finance Quantitative Solutions Group at Siebert Williams Shank.
And, that momentum continued through April: the fourth consecutive month of gains in 2025.
April was saved from losses due to the influx of supply after the tariff-induced volatility led many deals to be either postponed or moved to the day-to-day calendar during the week of April 7.
"The fund outflow cycle created some challenges for deals to get done and brought to market," said Jeff Timlin, a managing partner at Sage Advisory.
At the start of the month, MMD yields rallied 18 to 29 basis points, before selling off 85 to 98 basis points between Monday, April 7, and Wednesday, April 9, the day Trump's sweeping tariffs were set to take effect.
On April 9, Trump announced a 90-day pause on tariffs against all countries except China, which sent MMD yields rallying 45 to 48 basis points on Thursday, April 10, before selling off again on Friday, April 11, with yields cut 25 to 27 basis points.
"There were transgressions of the tariff announcements and rollbacks, and then announcements, and then rollbacks and then announcements introduced a tremendous amount of volatility like we haven't really seen since the onset of COVID," said David Grean, vice president, trader and strategist at Payden & Rygel.
However, since then, the market has stabilized somewhat, with muni yields exhibiting smaller swings in either direction, and issuance has returned to the market.
Last week alone saw $14 billion of issuance on tap, as some delayed deals priced along with those already scheduled to come to market that week.
And issuance this week totaled $14.7 billion, but the biggest deals, the District of Columbia with $1.491 billion income tax secured revenue bonds, the East Bay Municipal Utility District with $1.095 billion water system revenue bonds and the Los Angeles Department of Water and Power with $993.525 million power system revenue bonds, were set to price May 1.
However, the District of Columbia and the East Bay Municipal Utility District accelerated their deals to price on Wednesday, while Bon Secours Mercy Health came to market with $671.22 million of hospital facilities revenue bonds through three separate issuers.
These deals were sufficient to push issuance slightly above the 2024 figure.
Some deals have been accelerated this week due to potential challenges on the horizon, such as tariffs and some uncertainty risks, Timlin said.
And given that it's hard to predict market movements on a day-to-day basis and everything can change from second to second, issuers have become more aggressive in accelerating their deals or sneaking them into this "more normalized market," he said.
So if the market conditions are right, Timlin said it's better to take advantage of them, as volatility could be right around the corner, he said.
April issuance details
Tax-exempt issuance in April rose 10.7% to $40.648 billion in 655 issues from $36.717 billion in 626 issues a year ago. Taxable issuance was up 7.5% to $4.585 billion in 66 issues from $4.266 billion in 69 issues in 2024. AMT issuance was $593.4 million, down 85% from $3.963 billion in 2024.
New-money issuance ticked up 0.5% to $31.258 billion from $31.101 billion, while refundings dropped 46.9% to $4.603 billion from $8.661 billion.
Revenue bond issuance decreased 35.8% to $19.836 billion from $30.89 billion in April 2024, while general obligation bond sales rose 84.9% to $25.99 billion from $14.055 billion in 2024.
Negotiated deal volume rose 8.6% to $37.642 billion from $34.766 billion a year prior. Competitive sales dropped 11% to $8.004 billion from $8.994 billion in 2024.
Bank-qualified issuance rose 5.9% to $674.6 million in 166 deals from 637.2 million in 161 deals a year prior.
In the states, the Golden State claimed the top spot year-to-date.
Issuers in California accounted for $29.589 billion, up 27.4% year-over-year. New York was second with $21.493 billion, up 11.1%. Texas was third with $15.669 billion, down 13.5%, followed by Florida in fourth with $6.364 billion, down 29.5%, and Massachusetts in fifth with $5.686 billion, a 4.5% decrease from 2024.
Rounding out the top 10: Ohio with $5.117 billion, up 226%; Pennsylvania with $5.075 billion, up 55%; Illinois with $4.819 billion, up 91.2%; Colorado with $4.738 billion, up 45.7%; and Wisconsin with $4.591 billion, up 31.5%.


