The New York City Transitional Finance Authority began the first of a two-day order period geared toward retail investors who will be looking to get their hands on some supply in the holiday-shortened trading week.
Weekly bond volume is estimated to total $3.6 billion, consisting of $1.6 billion of negotiated deals and $2 billion of competitive sales.
Municipals were mixed as traders and other market participants returned from the Labor Day holiday weekend.
Primary market
This week the NYC TFA will issue over $1.4 billion of future tax secured subordinate fiscal 2019 bonds.
On Tuesday, Loop Capital Markets opened a retail order period on the TFA’s $902.47 million of tax-exempt fixed-rate bonds ahead of the institutional pricing on Thursday.
Additionally, the TFA is set to sell $500 million of taxable bonds in two competitive sales on Thursday.
The financial advisors are Public Resources Advisory Group and Acacia Financial Group and the bond counsel are Norton Rose and Bryant Rabbino.
The deals are rated Aa1 by Moody’s Investors Service and AAA by S&P Global Ratings and Fitch Ratings.
Proceeds from the sale will be used to fund capital projects, with the exception of proceeds from about $150 million of the tax-exempt fixed-rate bonds, which will be used to convert outstanding floating-rates into fixed-rates.
On Wednesday, Wells Fargo Securities is expected to price the University of Chicago’s $400 million of Series 2018C taxable fixed-rate bonds.
The corporate CUSIP deal is rated Aa2 by Moody’s, AA-minus by S&P and AA-plus by Fitch.
Tuesday’s bond sale
New York:
Prior week's top underwriters
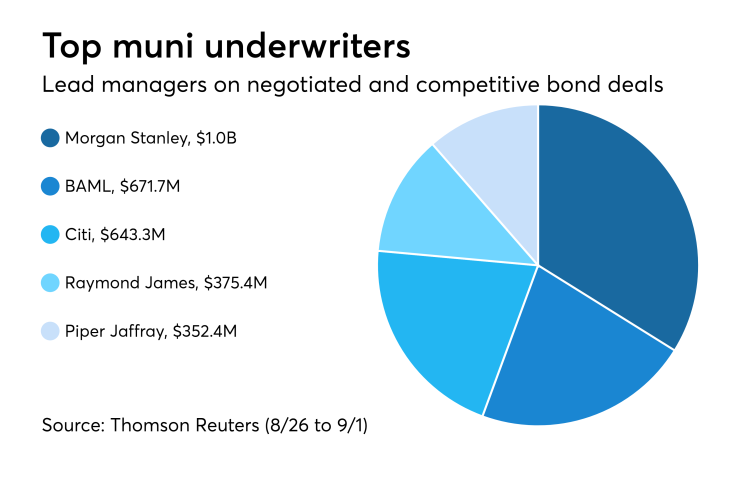
The top municipal bond underwriters of last week included Morgan Stanley, Bank of America Merrill Lynch, Citigroup, Raymond James & Associates and Piper Jaffray, according to Thomson Reuters data.
In the week of Aug. 26 to Sept. 1, Morgan Stanley underwrote $1.0 billion, BAML $671.7 million, Citi $643.3 million, Raymond James $375.4 million and Piper Jaffray $352.4 million.

Bond Buyer 30-day visible supply at $8.90B
The Bond Buyer's 30-day visible supply calendar increased $809.5 million to $8.90 billion for Tuesday. The total is comprised of $4.24 billion of competitive sales and $4.66 billion of negotiated deals.
Prior week's top FAs
The top municipal financial advisors of last week included PFM Financial Advisors, FTN Financial Capital Markets, Kaufman Hall & Associates, Piper Jaffray and Montague DeRose & Associates, according to Thomson Reuters data.
In the week of Aug. 26 to Sept. 1, PFM advised on $1.1 billion, FTN $298.2 million, Kaufman $271.6 million, Piper Jaffray $268.5 million, and Montague $250.9 million.

Steady as she goes: Slope of the muni yield curve
For the first time in 11 years the yield differential between two-year and 10-year Treasury bonds fell below 20 basis points, leading to speculation of a possible recession ahead, Janney Managing Director Alan Schankel wrote in a Tuesday market comment.
“History tells us that an inverted yield curve (short-term yields higher than long-term yields) is often a predictor of upcoming recession,” Schankel said. “According to research from the San Francisco Federal Reserve Bank, every recession since at least 1955 (nine in total) was preceded by an inversion of the yield curve, with only one false positive in the mid-1960s. The curve is not inverted yet and may not reach that point anytime soon, but it bears watching.”
Tax-exempt yields typically track Treasury yields directionally, but recent months have seen a divergence in shorter maturities.
The two-year maturity Treasury yield has risen from 1.88% in January to 2.68% recently, pushed higher by two increases in the Fed Funds target rate this year and one last December. However, Schankel says the two-year municipal benchmark yield has been relatively steady, rising from 1.56% to 1.69%, suggesting muni investors are buying shorter maturities.
“Despite the ongoing economic expansion, we continue to see minimal upside pressure on long term interest rates, and so encourage municipal bond investors to take advantage of the steeper muni curve slope and focus on the five-year to 15-year portion of the curve rather than staying short,” Schankel said.
Secondary market
Municipal bonds were mixed on Tuesday, according to a midday read of the MBIS benchmark scale. Benchmark muni yields fell as much as seven basis points in the one- to four-year maturities and as much as one basis point in the nine- to 11-year and 19- to 22-year maturities and rose as much as one basis point in the five- to eight-, 13- to 17- and 24- to 30-year maturities and remained unchanged in the 12-, 18- and 23-year maturities.
High-grade munis were also mixed, with yields calculated on MBIS’ AAA scale falling as much as one basis point in one- and two-, nine- to 12- and 17- to 24-year maturities and rising as much as a basis point in the three- to eight-, 13- to 16- and 27- to 30-year maturities.
Municipals were mixed on Municipal Market Data’s AAA benchmark scale, which showed the yield on the 10-year muni general obligation rising as much as two basis points while the yield on 30-year muni maturity fell as much as one basis point.
Treasury bonds were weaker as stock prices traded lower.
On Friday, the 10-year muni-to-Treasury ratio was calculated at 85.6% while the 30-year muni-to-Treasury ratio stood at 100.7%, according to MMD. The muni-to-Treasury ratio compares the yield of tax-exempt municipal bonds with the yield of taxable U.S. Treasury with comparable maturities. If the muni/Treasury ratio is above 100%, munis are yielding more than Treasury; if it is below 100%, munis are yielding less.
Previous session's activity
The Municipal Securities Rulemaking Board reported 24,652 trades on Friday on volume of $6.65 billion.
California, Texas and New York were the municipalities with the most trades, with Golden State taking 15.212% of the market, the Lone Star State taking 12.028% and the Empire State taking 11.694%.
Prior week's actively traded issues
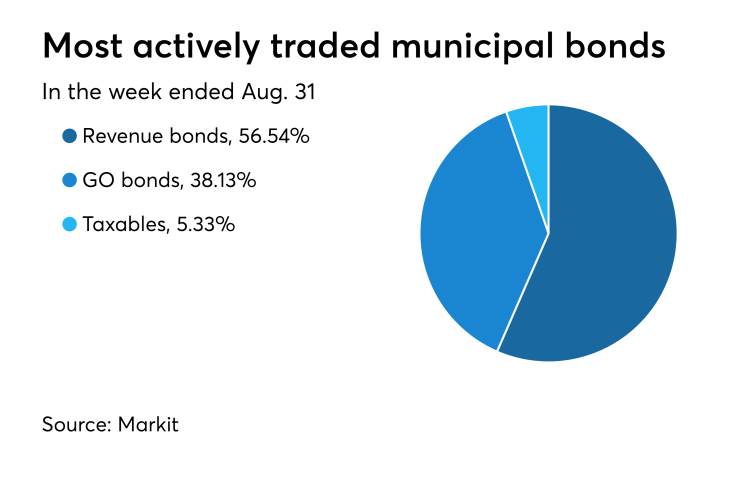
Revenue bonds comprised 56.54% of total new issuance in the week ended Aug. 31, up from 56.53% in the prior week, according to

Some of the most actively traded munis by type were from Puerto Rico and Texas issuers. In the GO bond sector, the Puerto Rico 8s of 2035 traded 39 times. In the revenue bond sector, the Texas 4s of 2019 traded 238 times. And in the taxable bond sector, the Puerto Rico Sales Tax Financing Corp. 6.35s of 2039 traded 18 times.
Treasury auctions discount rate bills
Tender rates for the Treasury Department's latest 91-day and 182-day discount bills were higher, as the $48 billion of three-months incurred a 2.095% high rate, up from 2.080% the prior week, and the $42 billion of six-months incurred a 2.240% high rate, up from 2.210% the week before.
Coupon equivalents were 2.135% and 2.297%, respectively. The price for the 91s was 99.470431 and that for the 182s was 98.867556.
The median bid on the 91s was 2.075%. The low bid was 2.050%. Tenders at the high rate were allotted 25.14%. The bid-to-cover ratio was 2.88.
The median bid for the 182s was 2.220%. The low bid was 2.200%. Tenders at the high rate were allotted 40.90%. The bid-to-cover ratio was 3.03.
Gary Siegel contributed to this report.
Data appearing in this article from Municipal Bond Information Services, including the MBIS municipal bond index, is available on The Bond Buyer Data Workstation.


