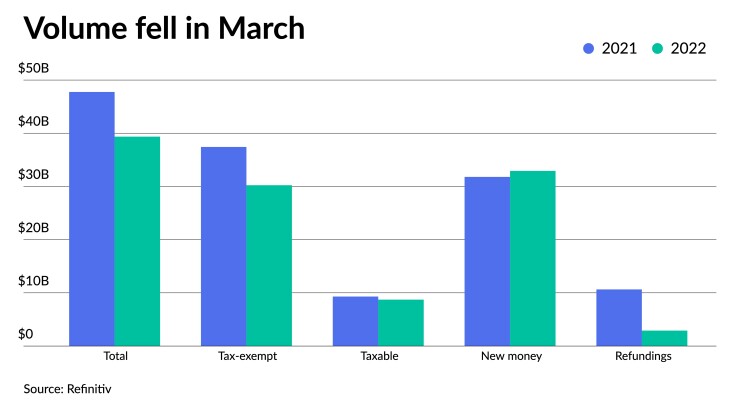
Municipal issuance fell 17.6% year-over-year in March led in part by a drop in refunding volumes amid continuing market volatility and a rising-rate environment, but the total $39.4 billion figure is above the $34.363 billion 10-year average.
Total March volume was $39.363 billion in 793 deals versus $47.763 billion in 1,218 issues a year earlier. Taxable issuance totaled $8.725 billion in 114 issues, down 6.3% from $9.308 billion in 238 issues a year ago. Tax-exempt issuance was down 19.2% to $30.233 billion in 675 issues from $37.430 billion in 970 issues in 2021.
New-money issuance was up 3.5% to $32.922 billion in 644 transactions from $31.800 billion a year prior while refunding volume decreased 72.7% to $2.907 billion from $10.648 billion in 2021. Alternative minimum tax issuance dropped to $404.9 million, down 60.5% from $1.025 billion.

The beginning of the calendar year is normally sluggish, but due to market volatility and issuer worries over rate volatility, supply was notably sparse in January and February. Issuance typically builds through March before taxes are due in April, but issuers held back more, which Pat Luby, senior municipal strategist at CreditSights, attributes, in part, to a high level of uncertainty in the market.
“There's definitely less demand in the market making it more challenging for underwriters to place new issues. So even with the scales getting cheaper, for some issuers, it's probably more challenging to find buyers given current market conditions,” said Pat Luby, a senior municipal strategist at CreditSights.
Many participants are waiting to see what the Fed will do next, said Jeff Lipton, managing director of credit research at Oppenheimer Inc.
The Fed hiked interest rates 25 basis points at the Federal Open Market Committee meeting on March 16 and said it would raise rates six more times this year. Despite this, Lipton said there’s still vagueness around whether the Fed will implement a quarter- or half-point rate hike at its next meeting in May.
Compounding the issue of uncertainty in the marketplace, Lipton said, is Russia’s invasion of Ukraine and the inversion of the U.S. Treasury curve for the first time since 2019, which could possibly signal a recession.
“There's a lot of uncertainty and that uncertainty brings about a great deal of issuer pause,” he said.
But, overall muni credit is in good shape, according to Lipton, which he said can be ascribed to “part of the fundamental soundness to the various levels of stimulus that had been allocated to state and local governments and enterprise units.”
There's still a fair amount of federal stimulus money that has not been disbursed and as state and local governments craft their budgets, he said they're going to consider how best to allocate that money.
“It sounds like they want to prepare themselves as rates move higher, they just want to stockpile,” Lipton said.
While taxables dropped year-over-year, they rose 209% from February's $2.825 billion total.
Luby said taxable deals are easier to structure and plan than tax-exempt deals.
And with the knowledge that interest rates will move higher, Lipton said certain issuers, such as higher education and healthcare issuers, can raise this capital now at a lower cost. Selling taxable bonds allows issuers to maintain flexibility and have a pool of money on hand without necessarily indicating what they would do with that cash, as they would have to with tax-exempts.
In particular, universities have issued several large deals with taxable bonds, which Lipton said, “speaks to the jump in taxable issue we're seeing.”
Barclays Capital and Goldman Sachs priced for the
Additionally, Citigroup Global Markets priced for the University of Massachusetts $608 million of taxable revenue bonds and J.P. Morgan Securities priced for Howard University $300 million of taxable corporate CUSIP bonds.
For 2022, issuance predictions range from $420 billion to as high as $550 billion, though it is highly unlikely that issuance will
But less volume isn’t necessarily a bad thing, as some participants argue the dearth of issuance has helped to keep municipal yields lower as the market contends with large mutual fund outflows and increased selling pressure all around.
“If there's less volume, that could help provide some stability to the market with much less paper available for reinvestment and redemption flows are going to continue, especially as we get closer to summer months,” Luby said.
Issuance details:
Issuance of revenue bonds decreased 24.7% to $21.910 billion from $29.094 billion in March 2021, and general obligation bond sales dropped 6.5% to $17.452 billion from $18.669 billion in 2021.
Negotiated deal volume was down 15.3% to $30.764 billion from $36.316 billion a year prior. Competitive sales also decreased to $8.169 billion, or 12.0% from $9.278 billion in 2021.
Deals wrapped by bond insurance were up 49.9%, with $3.133 billion in 127 deals from $2.090 billion in 193 deals a year prior.
Bank-qualified issuance dropped to $854.7 million 221 deals from $1.653 billion in 414 deals in 2021, a 48.3% decrease.

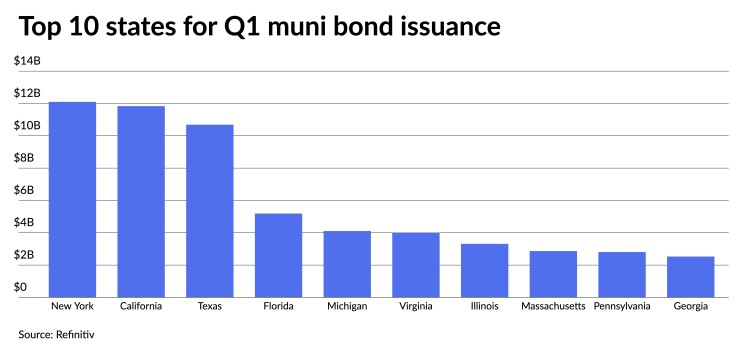
In the states, New York overtook Texas for the top spot.
Issuers in the Empire State accounted for $12.097 billion, down 19.0% year-over-year. California was second with $11.8833 billion, down 46.1%. Texas was third with $10.685 billion, down 8.8%, Florida is fourth with $5.189 billion, up 57.2%, and Michigan rounds out the top five with $4.107 billion, a 185.6% increase from 2021.
The rest of the top 10 are: Virginia with $4.004 billion, up 130.0%; Illinois with $3.312 billion, down 17.9%; Massachusetts with $2.867 billion, up 18.9%; Pennsylvania at $2.805 billion, down 29.5%; and Georgia with $2.529 billion, up 137.4%.


