Data released on Tuesday suggest the economy is improving, with different sectors moving at varying paces.
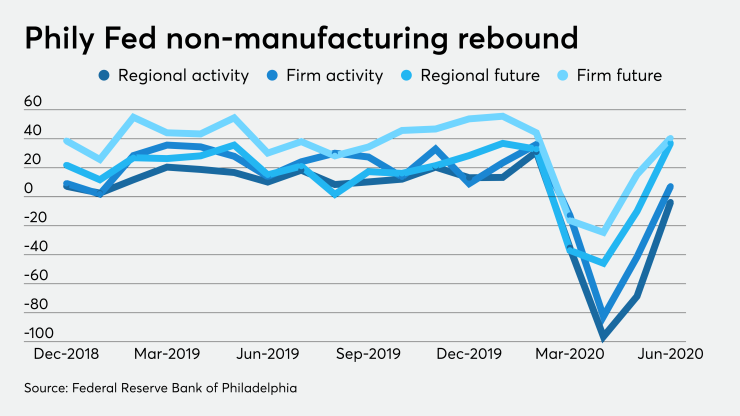
Nonmanufacturing firms reported "continued weakness" in the Philadelphia region, but most of the survey’s current indicators were better than last month's numbers, according to data related by the Federal Reserve Bank of Philadelphia on Tuesday.

The index for general activity at the firm level rebounded to positive 7.3 in June from negative 41.4 in May. The regional activity index improved to negative 3.6 from negative 68.6.
The new orders index narrowed to negative 12.6 from negative 32.6, posting its second straight double-digit rise.
The sales/revenue index gained to positive 0.3 from negative 50.8.
The full-time employment index improved to negative 13.3 from negative 23.3, while the part-time employment index climbed to negative 24.4 from negative 37.4.
The wages and benefits cost index gained to negative 3.5 from negative 14.5 and the average workweek index had its first positive reading since February, improving to positive 6.7 from negative 36.7.
Looking six months ahead, the diffusion index for future activity at the firm level gained to positive 40.5 from positive 15.4, while the future regional activity index rose to positive 37.1 from negative 10.0.
New home sales
New home sales gained to a seasonally adjusted annual rate of 676,000 in May, 16.6% above the revised rate of 580,000 in April and 12.7% above the May 2019 pace of 600,000, according to the Commerce Department. The April number was originally reported as 623,000.
Economists polled by IFR estimated a pace of 639,000 new home sales in the month.
The median sales price in May was $317,900, while the average price was $368,800.
“The recovery in the new home market continues, as confirmed by the Census Bureau release of the May 2020 sales figures,” said Gregg Logan, managing director and director of community and resort at RCLCO. “Although new home sales declined substantially in March, by mid-April, even before the states began to re-open, home builders and community developers were reporting an increase in new home sales.”
And with the trend continuing, he said, “we expect continued strengthening in the housing market will be demonstrated when the July figures are released a month from now. There has of course been some concern about what would happen when the impacts of the government ‘stimulus’ winds down, but so far the numbers are looking good for the housing industry.”
Since it takes months to complete a sale, "May’s existing sales reflect activity in March-April, the peak of the lockdown," noted Roiana Reid, U.S. economist at Berenberg Capital Markets. "We expect a strong rebound in existing home sales in coming months as delayed transactions are completed."
Richmond Fed
Manufacturing in the Federal Reserve Bank of Richmond's district "held fairly steady” in June, according to its latest survey.
The composite index increased to zero in June from negative 27 in May.
Index readings above zero show expansion, while numbers below zero indicate contraction.
Shipments improved to negative 1 from negative 26, new orders rose to positive 5 from negative 35 and backlog of orders narrowed to negative 12 from negative 33.
The index for local business conditions rose to positive 5 from negative 42.
The number of employees index increased to negative five from negative 16, wages moved higher, to positive 1 from negative 3, and the average workweek rebounded to positive 1 from negative 24.
In the service sector, "activity remained soft” according to survey respondents.
The revenues index improved 20 points but, at negative 28, still suggested contraction, while the demand index gained to negative 16 from negative 40.
The local business condition index narrowed to negative 24 from negative 62.
The number of employees index rose to negative 7 from negative 26, while the average workweek also climbed to negative 7 from negative 26.
The prices paid trend index moved higher to 4.53 from 2.40 and prices received jumped to 3.06 from 1.01.


