A relatively large industrial revenue bond issue for Intel on Thursday closed out the primary in a holiday-shortened week.
Primary market
BofA Securities priced and repriced the Chandler Industrial Development Authority, Arizona’s (A1/A+/NR) $438.67 million of Series 2019 industrial development revenue bonds for Intel Corp.
The issue is due June 1, 2049 with a mandatory tender date of June 3, 2024.
The bonds were repriced at 114.184 as 5s to yield 2.00%; they were tentatively priced at 113.98 as 5s to yield 2.04%.
Proceeds will be used to finance the acquisition, construction and installation of industrial sewage and wastewater treatment facilities at Intel’s plant in Chandler. Squire Patton Boggs is the bond counsel; Wells Fargo Bank is trustee.
Thursday’s bond sale
ICI: April muni bond funds up
The combined assets of municipal bond funds rose 1.2% to $728.4 million in April from $719.4 million in March and $667.1 million in April 2018, the Investment Company Institute reported in its monthly survey Thursday.
Tax-exempt money market fund assets fell 3.7% in April to $133.3 million from $138.5 million in March, but were up from $132.0 million in April of last year.
Looking at new cash flows, ICI said municipal bond funds saw $6.343 billion of inflows in April after $7.723 billion of inflows in March. In the January-to-April period, muni bond funds saw $32.854 billion of inflows compared to $8.534 billion of inflows in the same period last year.
Tax-exempt money market funds saw $5.267 billion of outflows in April after $81 million of outflows in March. In the January-to-April period, the funds saw $12.454 billion of outflows compared to $222 million of inflows in the same period last year.
“[Total] bond funds had an inflow of $34.32 billion in April compared with an inflow of $28.90 billion in March. Taxable bond funds had an inflow of $27.98 billion in April versus an inflow of $21.18 billion in March,” ICI said. “Municipal bond funds had an inflow of $6.34 billion in April compared with an inflow of $7.72 billion in March.”
The combined assets of all U.S. mutual funds increased $393.43 billion, or 2%, to $19.65 trillion in April, the ICI said.
On Wednesday, ICI reported $1.9 billion of inflows to muni mutual funds in the week ended May 22 with ETFs seeing an additional $146 million inflow.
“The trend is continuing this week. MUB and VTEB, the two largest muni ETFs, both added shares [Wednesday] to reach new high assets totals,” Janney wrote in a market comment. “Unlike corporate high-yield funds, which have recently experienced outflows, HYD, the largest high-yield municipal ETF, had strong inflows [Wednesday] (+$19 million).”
Muni money market funds see outflows
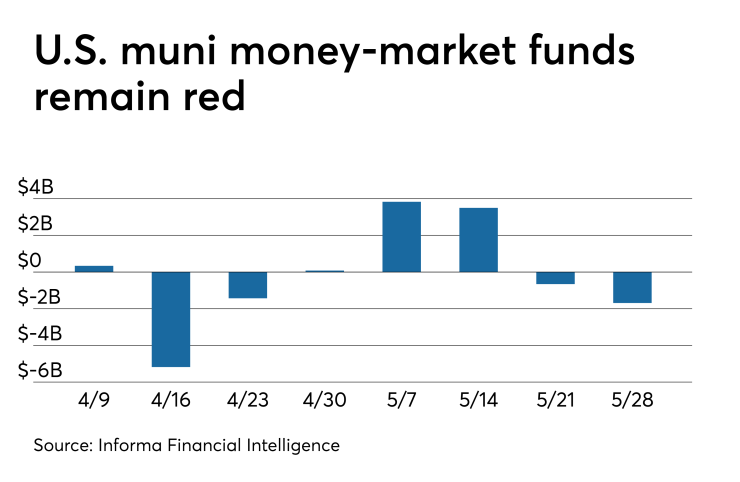
Tax-exempt municipal money market fund assets declined by $1.69 billion, with total net assets falling to $137.58 billion in the week ended May 27, according to the Money Fund Report, a publication of Informa Financial Intelligence. The average seven-day simple yield for the 190 tax-free and municipal money-market funds remained at 0.99% from the prior week, the Money Fund said on Wednesday.

Taxable money-fund assets grew by $18.95 billion in the week ended May 28, bringing total net assets to $2.972 trillion. The average, seven-day simple yield for the 808 taxable reporting funds was slipped to 2.02% from 2.04% last week.
Overall, the combined total net assets of the 998 reporting money funds rose $17.26 billion to $3.11 trillion in the week ended May 28, the highest total since total assets reached the $3 trillion threshold in early January.
Secondary market
Munis were stronger on the
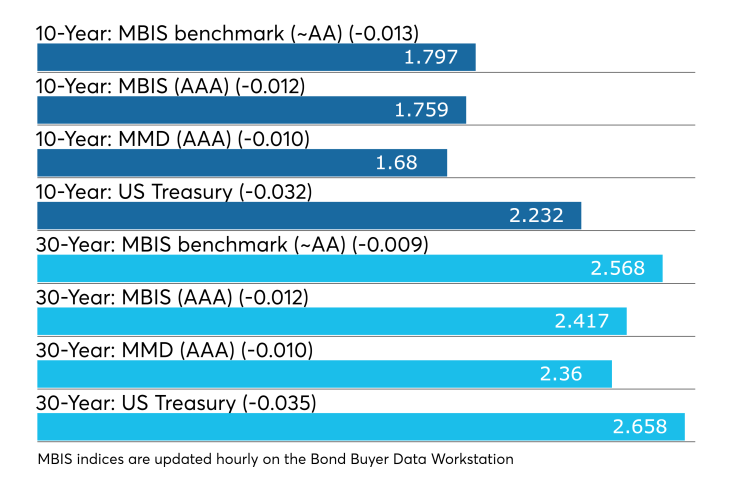
On Refinitiv Municipal Market Data’s AAA benchmark scale, the yield on the 10-year muni GOs dipped one basis point to 1.68% while the yield on the 30-year fell one basis point to 2.36%.
The 10-year muni-to-Treasury ratio was calculated at 75.3% while the 30-year muni-to-Treasury ratio stood at 88.7%, according to MMD.
Treasuries were stronger as stock prices traded little changed. In late Treasury trade, the three-month was yielding 2.361%, the two-year was yielding 2.073%, the 10-year was yielding 2.232% and the 30-year was yielding 2.658%.
“The quest-for-paper theme in the muni market continues with the ICE Muni Yield Curve down one basis point as Treasuries provided direction,” ICE Data Services said in a Thursday market comment. “Trading volumes have been light in this holiday-shortened week, though yesterday the muni curve outperformed Treasuries after lagging for several days. High-yield and tobacco bonds are steady. Taxable yields are one to two basis point wider off of Treasuries.”
Previous session's activity
The MSRB reported 40,169 trades Wednesday on volume of $13.25 billion. The 30-day average trade summary showed on a par amount basis of $12.42 million that customers bought $6.14 million, customers sold $4.08 million and interdealer trades totaled $2.20 million.
California, Texas and New York were most traded, with the Golden State taking 15.44% of the market, the Lone Star State taking 14.329% of the market, and the Empire State taking 9.499%.
The most actively traded security was the Los Angeles Unified School District, Calif., Series 2018B-1 GO 5.25s of 2042, which traded 12 times on volume of $53.74 million.
Treasury auctions bills
The Treasury Department Thursday auctioned $40 billion of four-week bills at a 2.330% high yield, a price of 99.818778. The coupon equivalent was 2.373%. The bid-to-cover ratio was 3.02. Tenders at the high rate were allotted 6.70%. The median rate was 2.300%. The low rate was 2.260%.
Treasury also auctioned $35 billion of eight-week bills at a 2.330% high yield, a price of 99.637556. The coupon equivalent was 2.377%. The bid-to-cover ratio was 2.74. Tenders at the high rate were allotted 31.07%. The median rate was 2.300%. The low rate was 2.270%.
Treasury to sell bills
The Treasury Department said Thursday it will auction $36 billion 91-day bills and $36 billion 182-day discount bills Monday.
The 91s settle June 6, and are due Sept. 5, and the 182s settle June 6, and are due Dec. 5. Currently, there are $38.992 billion 91-days outstanding and $25.999 billion 182s.
Gary E. Siegel contributed to this report.
Data appearing in this article from Municipal Bond Information Services, including the MBIS municipal bond index, is available on The Bond Buyer Data Workstation.


