
Long-term municipal bond issuance in June surged 9%, marking the second straight month when volume was increased year-over-year following eight months of decreased volume. Refundings played a big role once again, as interest rates fell.
Total monthly volume grew to $43.92 billion in 1,292 transactions from $40.29 billion in 1,430 transactions in June 2015, according to data from Thomson Reuters. It was the highest total for June in eight years, and the most for any month since March 2015, when volume hit $45.60 billion.
"After one of the largest months in terms of issuance in recent history, supply should decline in June-August. It happens pretty much every year, but likely more so in 2016," said Mikhail Foux, director, research, at Barclays Capital. "One of the main reason issuance was up in May-June was a spike in new money long-term issuance in the summer of 2006 – some of these bonds are being refunded now."
Foux said that he also thinks uncertainty related to timing of the next rate hike also played a role, forcing some issuers move their supply forward.
Issuance for the first half fell to $218.54 billion in 6,679 issues, from the $226.74 billion in 7,405 issues during the first half of last year.
"June issuance on the surface was elevated at approximately $44 billion; one would have to go all the way back to 2008 to find a June that produced greater gross issuance," said Sean Carney, director and municipal strategist at BlackRock. "However it was not unforeseen given recent market dynamics."
Carney said that in credit markets, demand ultimately creates supply (with a lag), given the robust demand of the past 38 weeks coupled with a remarkable stretch in performance, it is not surprising to see issuance pick-up.
Another contributor, according to Carney, is that as the broader market has re-priced the likelihood of interest rate increase by the Fed. Earlier this year, the market expected policy makers to raise rates four times; after Britain voted last week to leave the European Union, analysts expect zero to one rate increases, which has enticed greater refunding activity.
"The negative arbitrage associated with advanced refundings has become more favorable with the shape of the curve and we anticipate this will continue to be the case in the near-term," Carney said.
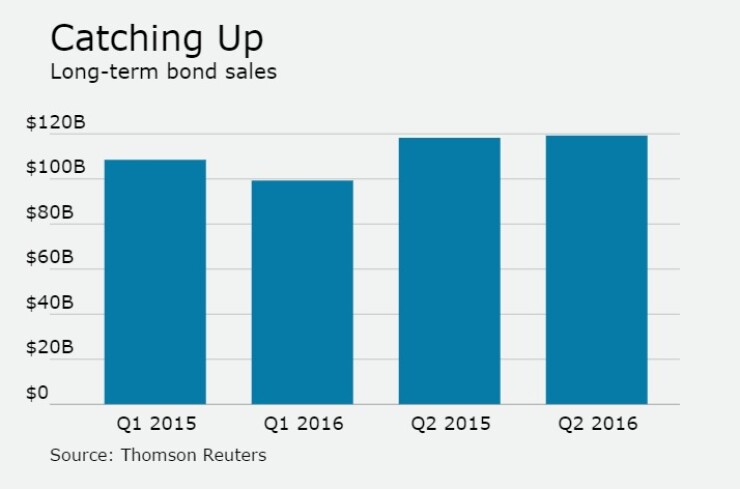
At the end of the first quarter, issuance was 8.5% lower than it was the previous year at $99.29 billion from $108.49 billion. However, second quarter generated $119.25 billion, slightly above the $118.25 billion issued during the second quarter of 2015.
For the month, refundings soared 30.8% to $18.38 billion in 472 deals from $14.05 billion in 452 deals.
New-money deals rose 6.1% to $20.57 billion in 703 issues from $19.38 billion in 858 issues.
"New money is running at about 40% of total this year; we do not expect any dramatic changes in the second half," Foux said. "This number is consistent with our projections."
Combined new-money and refunding issuance dropped by 27.7% in June, to $4.97 billion from $6.87 billion.
Issuance of revenue bonds decreased 6.9% to $22.34 billion, while general obligation bond sales improved 32.3% to $21.57 billion.
Negotiated deals were higher by 8.5% to $29.84 billion, while competitive sales increased by 33.9% to $13.05 billion.
"June saw a noticeable pick-up in competitive issuance which tends to be higher grade in nature thus we saw more triple-A issuance than in prior months helping create greater price transparency," said Carney. "Larger general obligation deals also tend to come competitive when the market is trading with ample liquidity providing good two-way flow into quarter-end."
Private placements plummeted 66.4% to $1.02 billion from $3.05 billion.
Taxable bond volume was 3.2% higher at $3.19 billion, while tax-exempt issuance inclined by 9.1% to $38.97 billion.
"We expected more taxable issuance, compared to last year, but it is not the case, as it is running at a slightly slower pace compared to 2015," said Foux.
Minimum tax bonds issuance jumped up to $1.76 billion from $1.49 billion.
Bond insurance sunk 25.8% this month, as the volume of deals wrapped with insurance declined to $2.24 billion in 189 deals from $3.02 billion in 202 deals.
Variable-rate short put bonds dropped 5.4% to $1.31 billion from $1.38 billion. Variable-rate long or no put bonds fell to $460 million from $490 million.
Bank qualified bonds increased 5.3% to $2.34 billion from $2.22 billion.
The sectors were split evenly, as issuance increased in five categories and declined in five. Development issuance decreased 52.2% to $1.13 billion from $2.36 billion. Electric power sales decreased 35.5% to $753 million from $1.17 billion and education transactions declined by 9.2% to $11.80 billion from $13.01 billion.
Transportation transactions increased 29.2% to $5.01 billion from $3.88 billion, general purpose deals improved to $14.12 billion from $10.44 billion and utilities advanced 61.6% to $5.12 billion from $3.17 billion.
"Issuance in the education and healthcare sectors is also up year-over-year; while transportation is down a bit, which is surprising," Foux said.
As far as the different entities that issue bonds, all saw positive year over year changes except districts, local authorities and direct issuers. State government was the biggest jumper, more than doubling to $8.73 billion from $3.52 billion.
California is the top issuer among states for the first half of the year, followed by Texas, New York, Florida and Pennsylvania.
The Golden State so far this year has issued $31.35 billion, with the Lone Star State right at its heels with $29.28 billion. The Empire State follows with $23.17 billion. The Sunshine State is in third with $9.75 billion and the Keystone State rounds out the top five with $9.02 billion.
"Our forecast is $370 billion for 2016," Foux said. "The pace of issuance was running pretty much on track until a major pick up in May-June, which was expected. We think that that the second half will be substantially slower in terms of supply, similar to last year, but the total number could be actually higher than our forecast."
Carney said that BlackRock has a higher prediction of year-end total volume.
"For most of the first half of 2016 year-over-year issuance has trailed that of 2015, however at the mid-point in the year this figure has almost equalized, making it very likely that gross issuance will eclipse $400 billion," Carney said. "It is also worth pointing out that certain high profile issuers have not been overly active in the primary market for various reasons compared to in prior years."


