Analysts more than ever are monitoring the ebb and flow of cash into municipal bond mutual funds.
As more money has found its way into the funds their influence on the market has increased, especially during times when selling or buying of funds' shares accelerates.
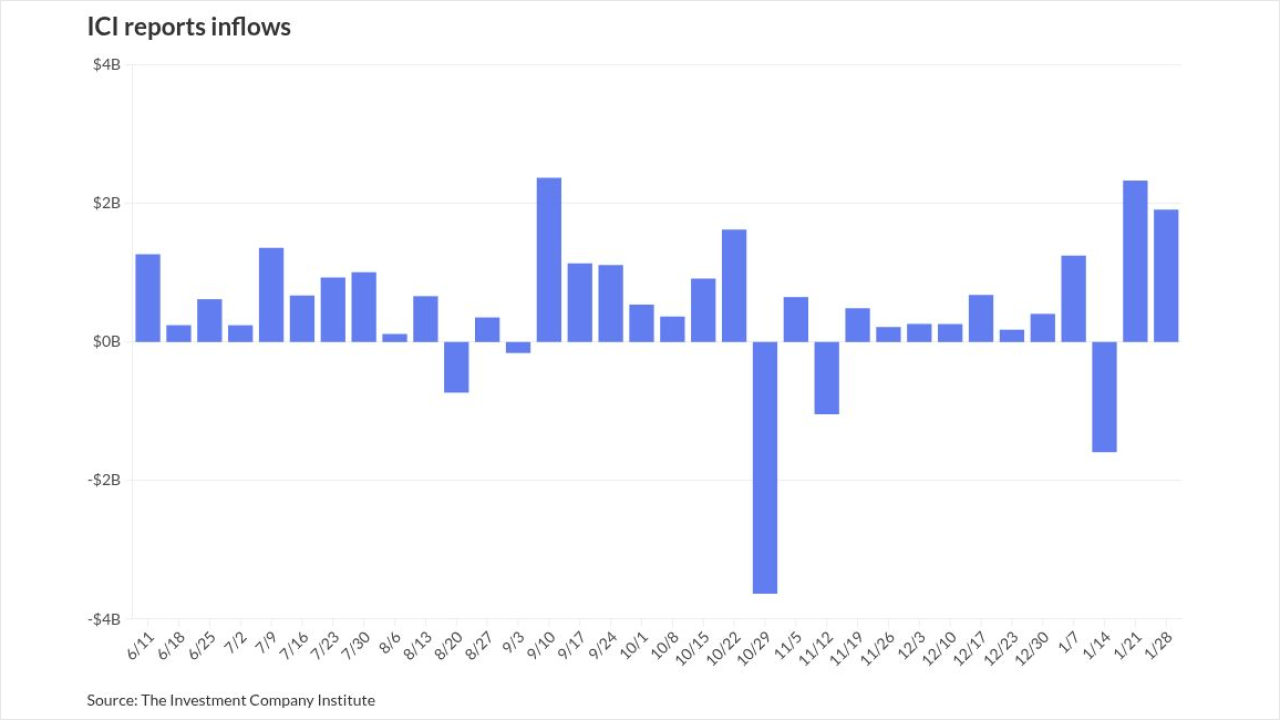
Industry participants have two major sources of data to mine to evaluate fund flows. But the Investment Company Institute and Lipper FMI employ different methodologies to assemble their numbers.
For the first quarter of 2012, BlackRock calculated that ICI figures show $16.7 billion in muni bond fund flows. The asset manager found the number from Lipper over the same period was $8.7 billion.
Traders have always found the fund flow numbers important. And a surge in investment over the last decade as well as increased volatility in flows over the past few years highlight the increasing significance that the market places on the fund flows data, industry pros say.
"You can use them to highlight a swing in momentum or shifts in sentiment," said Sean Carney, BlackRock muni strategist.
"They've always been important," added Chris Mauro, director of municipal bond research at RBC Capital Markets, referring to fund flows. "They have an outsized influence on the market, if you look at the data. They drive the municipal bid-wanted activity. There's a correlation between what happens in the mutual fund space and overall rates and ratios."
For its part, RBC's muni group writes market posts that analyze the weekly Lipper numbers. Anecdotally, much of the market is said to use Lipper numbers.
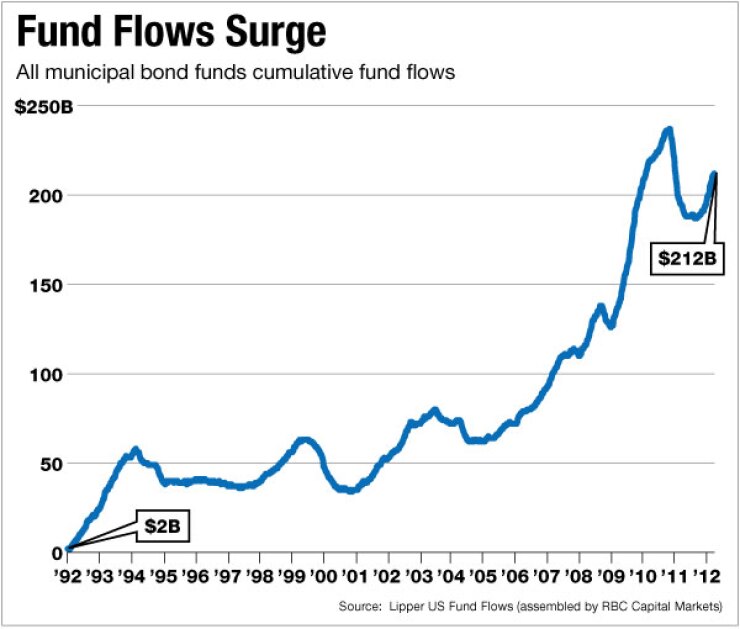
And the numbers for fund flows have increased in importance to the muni market because the amount of cash finding its way to muni bond funds has dramatically increased in recent years. From 1992 into the early parts of the last decade, the cumulative amount that investors put into muni funds amounted to about $50 billion, according to Lipper data assembled by RBC. That amount rose to around $70 billion from roughly 2002 through 2005.
In 2006, muni mutual funds saw net inflows start to soar, and by late 2010 cumulative funds flows had hit almost $240 billion. Early 2011 saw investors pull about $50 billion out of the funds amid predictions that bond defaults would increase. As of March, cumulative muni bond fund flows had rebounded to around $210 billion.
ICI says it covers 95% of the mutual fund industry in calculating its weekly estimated fund flow numbers, said Shelly Antoniewicz, a senior economist there. Its methodology involves exchanges into and out of funds, as well as reported distributions. It also includes some assets held outside of the funds.
"We do estimate their net new-cash flow," Antoniewicz said. "And we estimate it through getting their net asset value of the fund, the total net assets of the fund and then any distributions that the fund may have done during the week."
For its part, Lipper, part of Thomson Reuters, surveys 1,401 mutual funds from a total municipal bond universe of 1,739 funds over a weekly period, said Devin McCune, head of U.S. flows and MarketPlace at Thomson Reuters. It uses total net assets at the beginning and end of the period. It finds the dollar-amount change there's been in the total net assets to determine how much a fund has increased or decreased in size, McCune said.
Lipper finds the change in performance, or the value of the fund's shares from the beginning to the end of the period. It then "backs out" that performance from the total net-asset change to calculate net flow from the remainder, McCune said.
Lipper numbers are released on Thursdays and cover the previous week. ICI numbers for the week, by comparison, are released on the Wednesdays of the following week. Analysts note that the time delay can make it difficult to line the two up.
The strategic analytics group for the BMO Capital Markets' fixed-income team uses ICI numbers, according to Justin Hoogendoorn, the group's managing director. But the lag in receiving the numbers can pose problems.
When discussing supply and demand, analysts want to be as forward-looking as possible, he said. They want to know what is affecting the market today, or this week, he added.
"When you get information that's a week old, it's interesting to talk about," Hoogendoorn said. "But I find that I have other models that I put together that consider the municipal market on a rich-cheap basis. And a lot of my variables are real-time variables."
But the ICI numbers more properly reflect the strong demand in today's market, BlackRock's Carney said. He arrived at this conclusion after recent ICI numbers supported one market truism: fund flows often can be correlated to past performance.
Looking at ICI data, Carney noticed that the muni market performed solidly in January. It should therefore see an uptick in fund flows for February, he said. It did, which was consistent with the model.
"Traditionally, we've followed Lipper data," Carney said. "However, this year's ICI numbers seem to represent the demand component of the municipal market pretty consistently with what we're seeing."
Normally, on a macro level, the differences in the numbers are not extreme, McCune responded. One of the differentiating factors he sees in methodology centers around how ICI includes underlying variable annuity products in their calculation.
"We don't; we only look at open-end registered funds," McCune said. "That's the key differentiator. The universes are different."
Matt Fabian, a managing director at Municipal Market Advisors, says the research firm uses ICI numbers. The measures became important once the market saw that mutual fund holdings can be volatile, he said, as they have been since the massive swings in inflows and outflows that started in late 2010. But he doesn't necessarily find they need to be followed closely on a week-to-week basis.
"It's one more data point in a number of data points in how the funds are managing their money," Fabian said. "But it certainly is important to watch it, because it could drive big changes in the market."


