-
This volatility can be seen in the whipsawing figures from the SIFMA Municipal Swap Index Yield over the past few months, but in January in particular.
 February 12
-
"Even though it is hard to see the market falling out of bed and underperforming in the near term, we are more cautious going into March," Barclays PLC said in a report.
 February 9
-
Even though yields have moved to higher ground, some participants say that even cheaper levels are needed to bring about more retail conviction. Muni-to-UST ratios are still rich.
April 20
-
Household and U.S. bank ownership of individual bonds fell and the total face amount of munis outstanding was down 0.6% quarter-over-quarter and down 1.4% year-over-year, Fed data shows.
April 10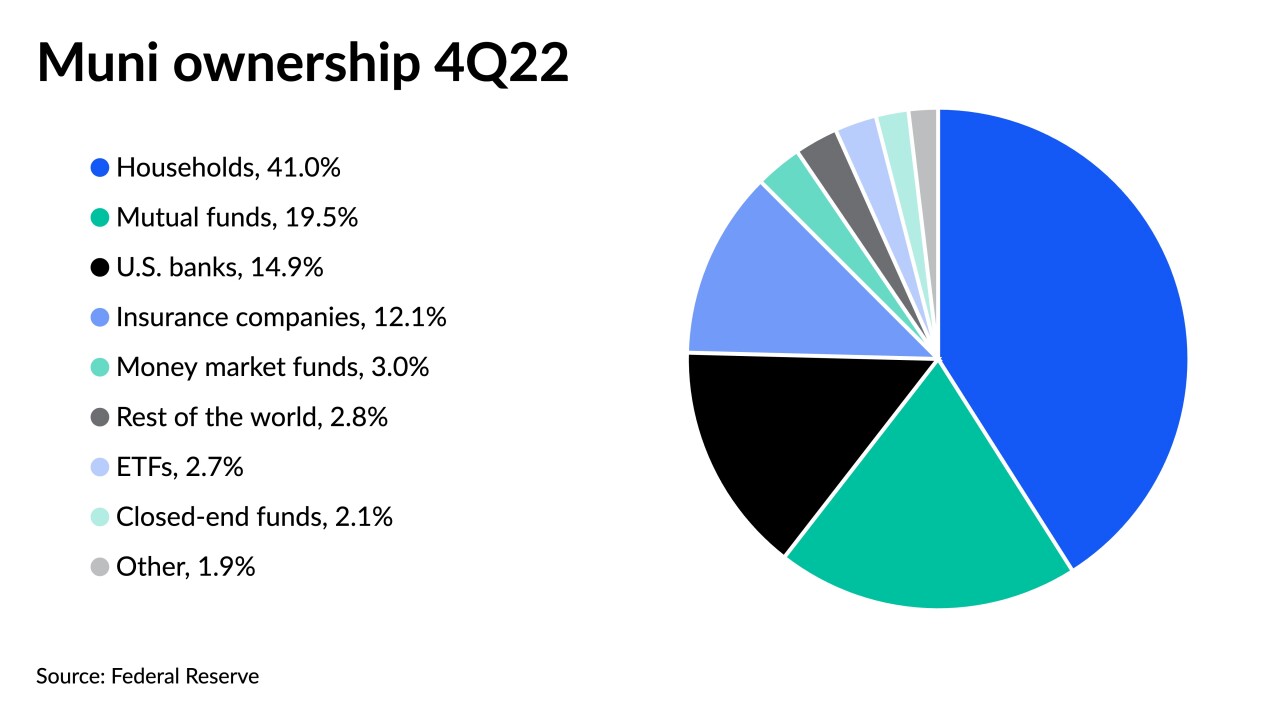
-
While muni performance has turned negative for October, "the asset class is significantly outperforming UST," said Jeff Lipton, managing director of credit research at Oppenheimer Inc.
October 25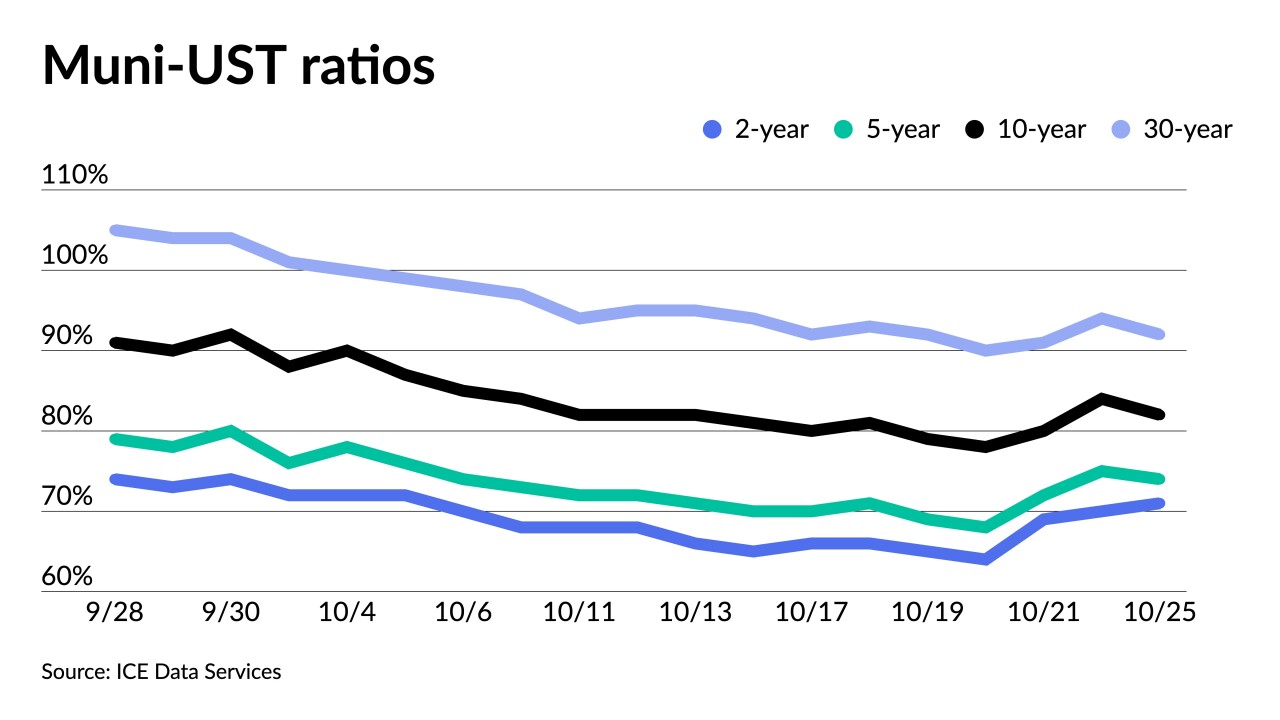
-
The short end was hammered in the secondary with large blocks of high-grades showing big swings to higher yields while the rest of the curve wasn't spared the damage and triple-A yields rose by seven to 16 basis points.
August 17
-
New-issue volume grows to $10.7 billion led by a $2.7 billion taxable Massachusetts ESG deal, $1.35 billion of Oklahoma natural gas taxables, $1.25 billion from the Regents of the University of California and $1.1 billion from New York City.
August 12
-
With the Fed committed to fighting inflation with aggressive rate hikes, fewer issuers want to take the risk with taxable advance refundings.
July 27
-
Investors pulled more from municipal bond mutual funds, with Refinitiv Lipper reporting $1.3 billion of outflows, down from the $1.6 billion the week prior and bringing the total to $47 billion year-to-date.
June 30
-
The lighter calendar may help ease the imbalance between demand and supply, as selling pressure in the secondary has weighed significantly on the market tone.
June 21
-
The 25-basis-point move to higher yields is the largest one-day change in triple-As since March 2020 when COVID began roiling markets. Munis could not ignore a continued selloff in UST led by inflation and recession concerns.
June 13
-
The Investment Company Institute reported investors added $1.090 billion from muni bond mutual funds in the week ending June 1, up from $4.367 billion of outflows in the previous week.
June 8
-
The seasonal factors of a supply and demand mismatch, reinvestment needs and strong credit fundamentals, have opened a window of opportunity.
 June 3
-
June redemptions will be the highest of the year at $50.6 billion. New-issue supply — 30-day visible is currently at $15.5 billion — is unlikely to keep up.
May 31
-
Total May volume was $31.167 billion in 750 deals versus $35.358 billion in 1,295 issues a year earlier. In a continuing trend, new-money issuance was up 14.2% in May year-over-year.
May 31
-
After nine months of a soft closure, two Nuveen high-yield mutual funds will resume accepting purchases from new investors in the face of improved market conditions.
May 27
-
The rapid swing to lower yields over the past week has led to a sunnier outlook for the summer reinvestment season, but uncertainties on the economic front, rate volatility, and supply questions hang overhead.
May 27
-
Triple-A yields continue to rise, with the two-year muni just below 2%, the five well above and the 10-year approaching 2.5%.
April 11
-
More outflows from municipal bond mutual funds were reported as bid lists surpass $1 billion 22 times in 2022.
March 23
-
For investors who want a customized portfolio and a greater ability to control taxable events, SMAs may be the product they're searching for.
March 23


