-
January's volume was $35.243 billion in 486 issues, up 10.8% from $31.817 billion in 554 issues in 2024, according to LSEG data.
 January 31
-
Sizable deals for next week include $1.3 billion of real estate transfer tax revenue bonds from the Triborough Bridge and Tunnel Authority and $996.335 million of second series revenue bonds from the San Francisco International Airport.
January 9
-
The muni market saw $507.585 billion of debt issued in 2024, up 31.8% from $385.061 in 2023. This surpasses the previous record of $484.601 billion in 2020 by more than $20 billion, per LSEG data.
December 31
-
In the remaining days of this year, "taxable rates continue to be pressured but munis are finding a stable, even supportive, bidside," said Kim Olsan, a senior fixed income portfolio manager at NewSquare Capital.
December 24
-
Most on the Street expect issuance to come in around $500 billion, but a few think volume will be much higher, primarily because of potential changes to the tax exemption. Most firms expect refunding volumes to also grow in 2025.
December 12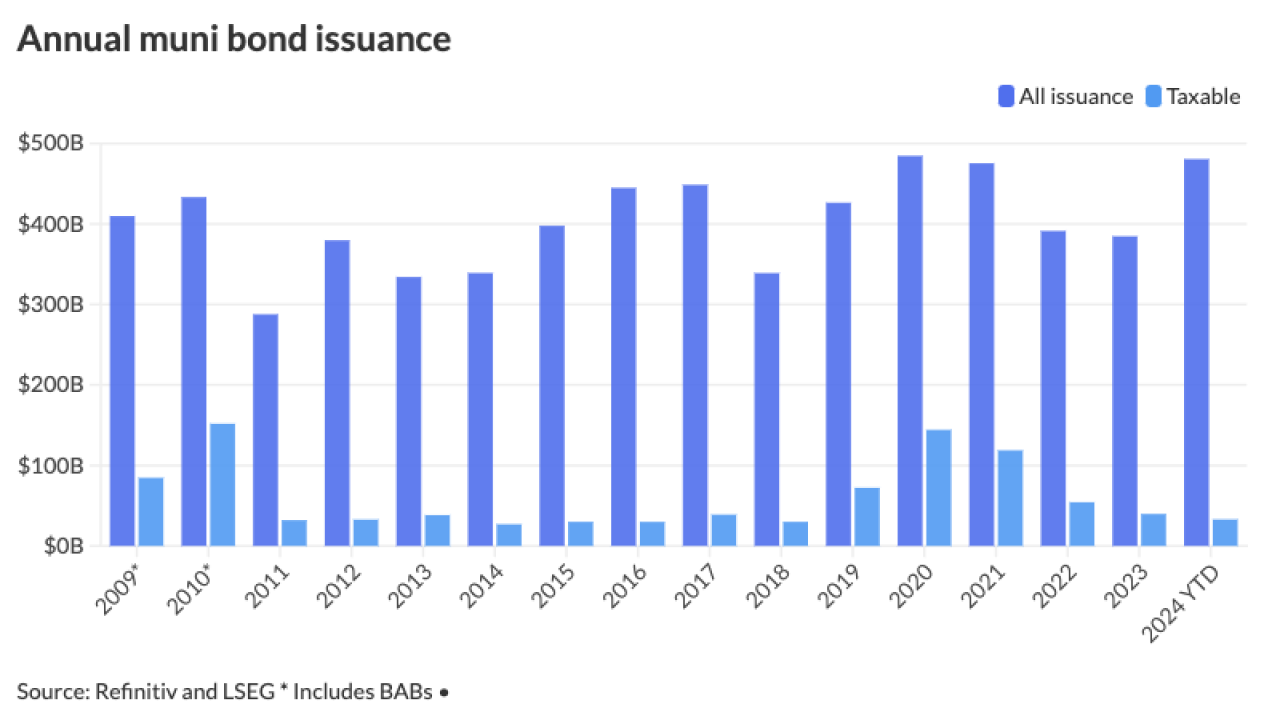
-
November's total is below the 10-year average of $32.278 billion and is the lowest monthly total this year. The year's total is about $25 billion short of $500 billion.
November 27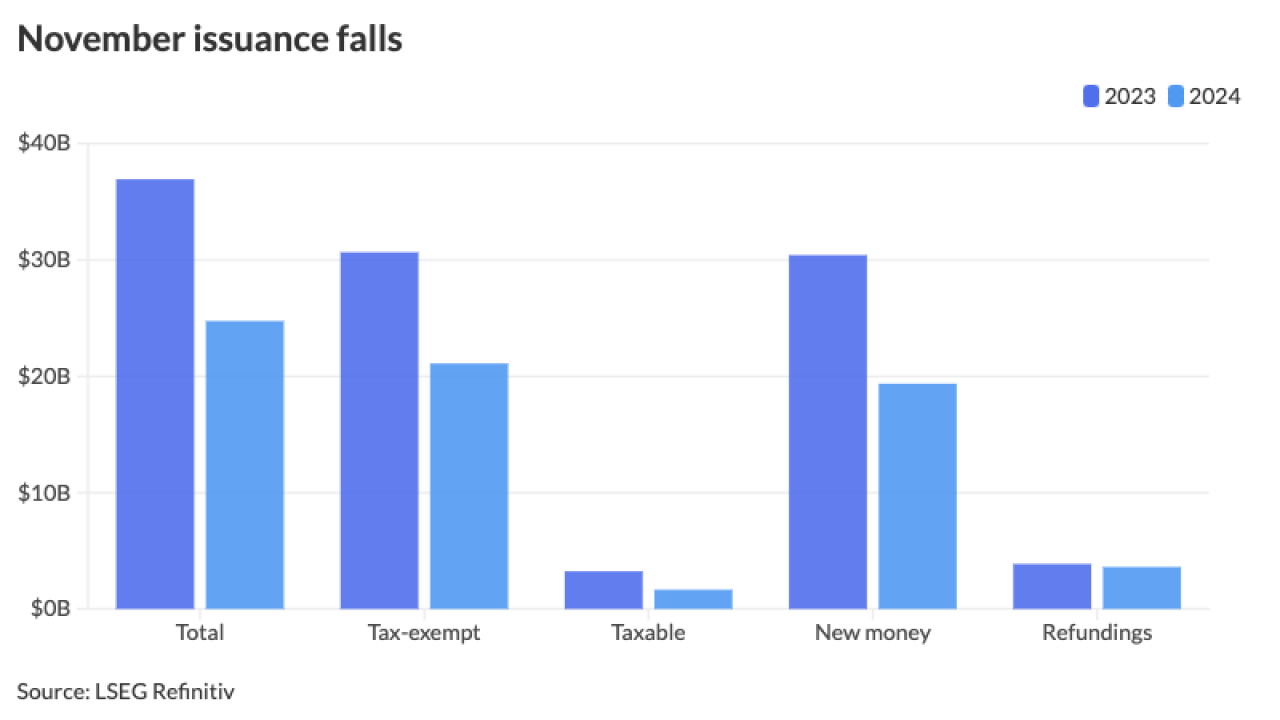
-
The month's total is above the 10-year average of $40.288 billion. The market needs to see about $45 billion of issuance in November and December to hit an all-time record year.
October 31
-

-
Municipal triple-A yield curves played catch up to USTs Friday to close out a week of more mixed economic data that has economists constantly reevaluating their Federal Reserve policy expectations with little consensus.
 October 11
-
Municipal bond insurers wrapped $28.921 billion in the first three quarters 2024, a 26.8% increase from the $22.814 billion insured in the first three quarters of 2023, according to LSEG data.
October 11
-
September volume came in over $44 billion leading volume year-to-date to hit more than $380 billion, just shy of 2023's full-year total issuance.
September 30
-
Issuance as of Wednesday is at $345.327 billion, a 32.7% increase over 2023. The Bond Buyer 30-day visible calendar on Monday was at $20.02 billion, the largest in nearly four years.
September 11
-
Municipal supply continues to grow as Bond Buyer 30-day visible supply sits at $20.02 billion and the municipal market will see one of the largest weeks of new-issuance at an estimated $13.35 billion, led by three billion-plus deals from Washington, D.C. ($1.6 billion), the New York City Transitional Finance Authority ($1.5 billion) and Illinois ($1 billion).
September 6
-
August's volume reached $49.174 billion in 873 issues, up 25% from 2023. August's total is above the 10-year average of $40.828 billion and is also the highest monthly total this year.
August 30
-
The calendar next week largely continues "the elevated pace of primary market volume seen since May, against a backdrop of broadly supportive fund flows (LSEG inflows for eight consecutive weeks), somewhat better dealer positions (although still heavy), mid-August reinvestment to spend, but lighter late summer attendance," said J.P. Morgan strategists led by Peter DeGroot.
August 23
-
Issuers in five Far West states increased their borrowing the first half of the year, while four saw sizable decreases.
August 23
-
The region's municipal bond volume grew by 42.4%, outpacing the nationwide 32% increase in a first-half marked by gas prepay deals and Brightline's big sale.
 August 22
-
Issuers in the eight-state region sold $50.6 billion of bonds with Texas accounting for 65% of the volume.
 August 20
-
Part of the surge in issuance came from issuers tapping the capital market after several years due to the inability to no longer postpone long-delayed projects and the drying up of pandemic aid.
August 19
-
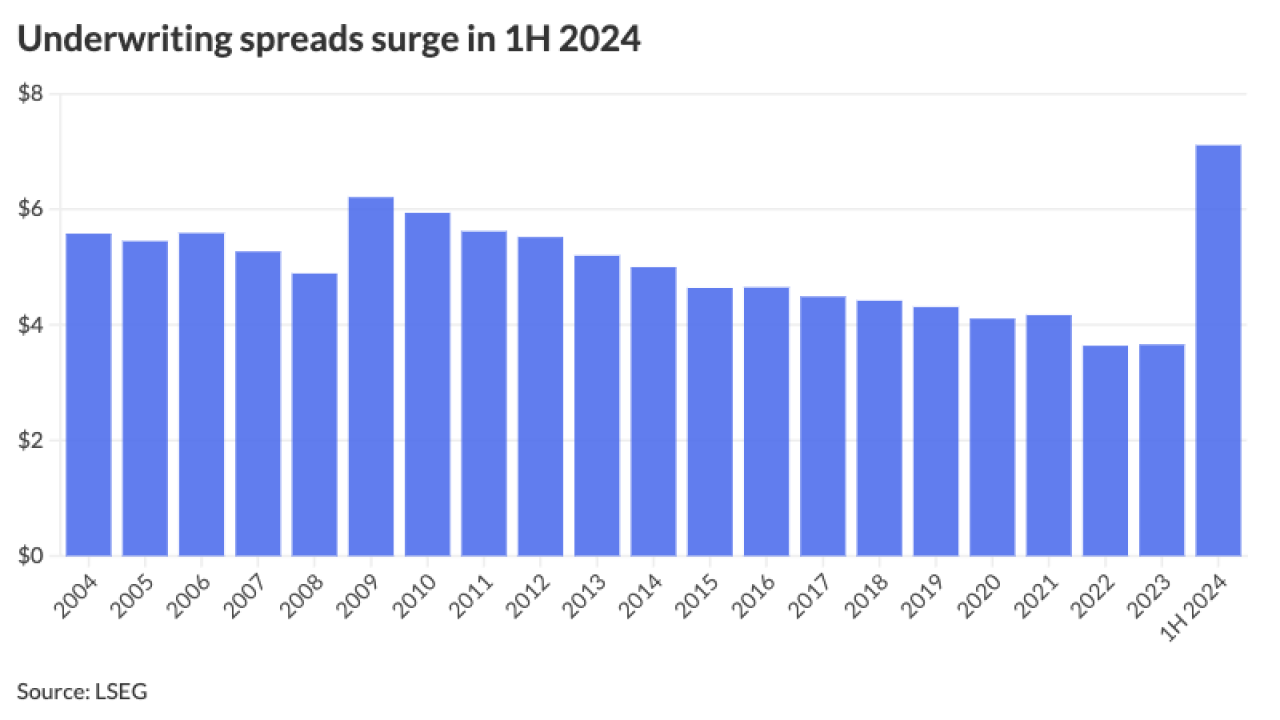
Underwriting spreads rose to $7.11 in the first half of 2024 from $3.70 in the first half of 2023.
August 15