-
Issuance was $34.308 billion in 471 issues, down 7.2% year-over-year from $36.982 billion across 536 transactions in 2025. However, this was the third-highest monthly figure for January and above the month's 10-year average of $29.699 billion
February 2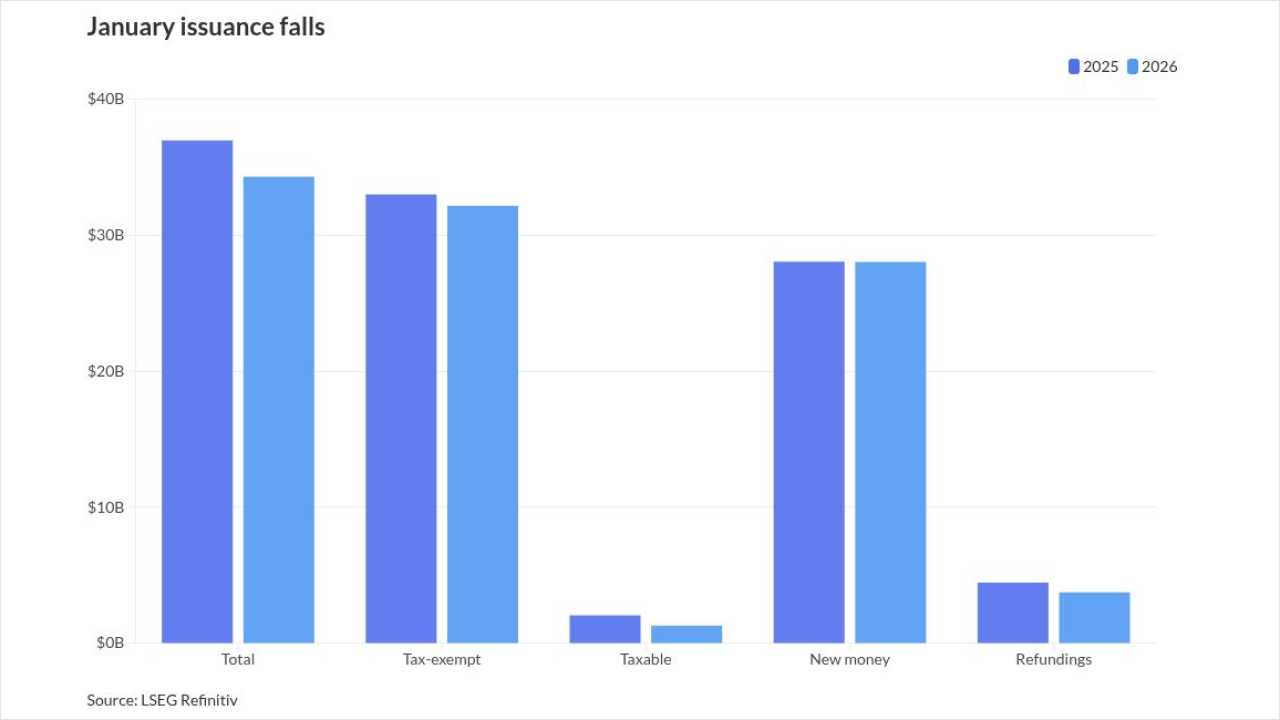
-
In this third of a three-part 2026 municipal bond outlook series, Market Intelligence analyst Jeff Lipton explains how another year of heavy supply, surging ETF and SMA assets, climate and cyber risk, and growing use of bond insurance will drive muni market structure and strategy for both sell-side and buy-side stakeholders.
January 8 The Bond Buyer
 -
Bond sales by Texas issuers rose 21% to $82.52 billion, putting the state in second place behind California and well ahead of third-place New York.
January 6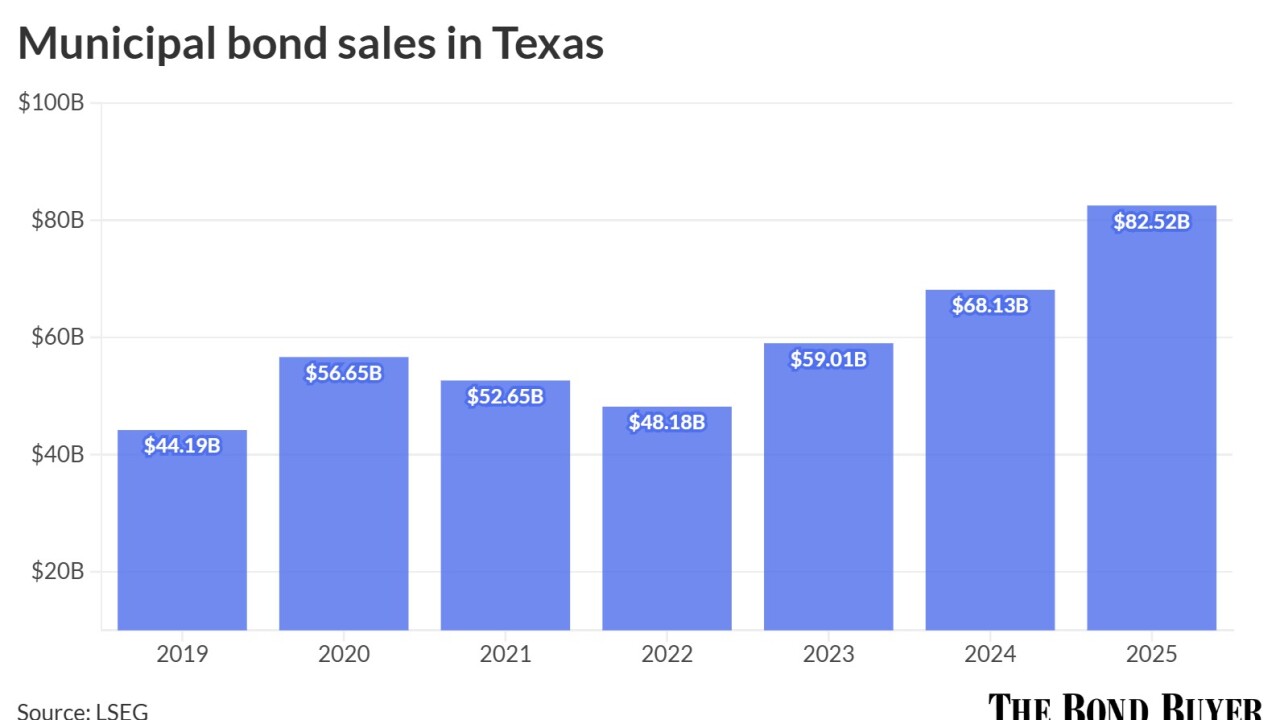
-
The muni market saw a record $579.936 billion of debt issued in 2025, up 12.9% from $513.652 billion in 2024, according to LSEG data.
January 2
-
Municipal bond supply projections for next year range from a high of $750-plus billion to a low of $520 billion, with most firms expecting issuance to hover around $600 billion, easily surpassing 2025's record.
December 10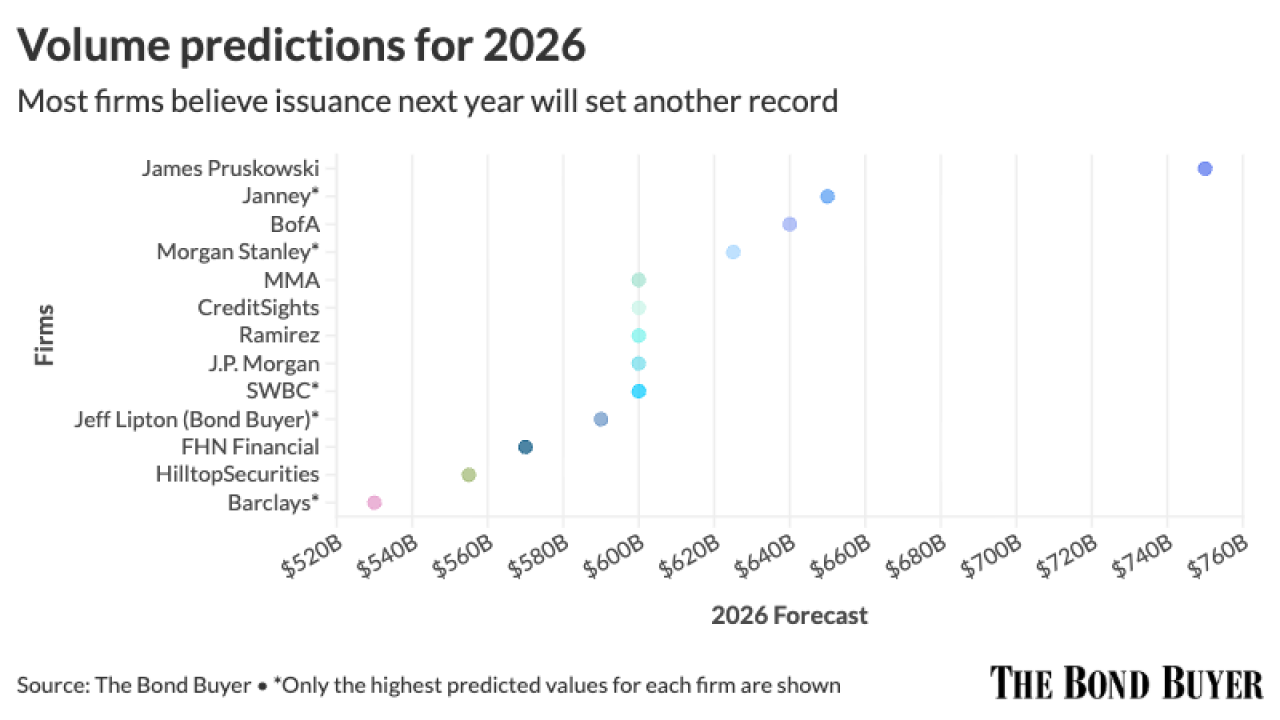
-
November volume was $38.487 billion, up 51.1% from $25.47 billion in 2024. This is above November's 10-year average of $33.743 billion.
December 1
-
Muni experts discussed how macroeconomic concerns and a volatile political environment are affecting the market as the market chalks up another record year of issuance.
November 4
-
Issuance year-to-date is $493.063 billion, up 9.3% from $451.079 billion over the same period. With issuance estimated at $13.118 billion in the first week of November, 2024's $500-plus billion record should fall within the next week or two.
October 31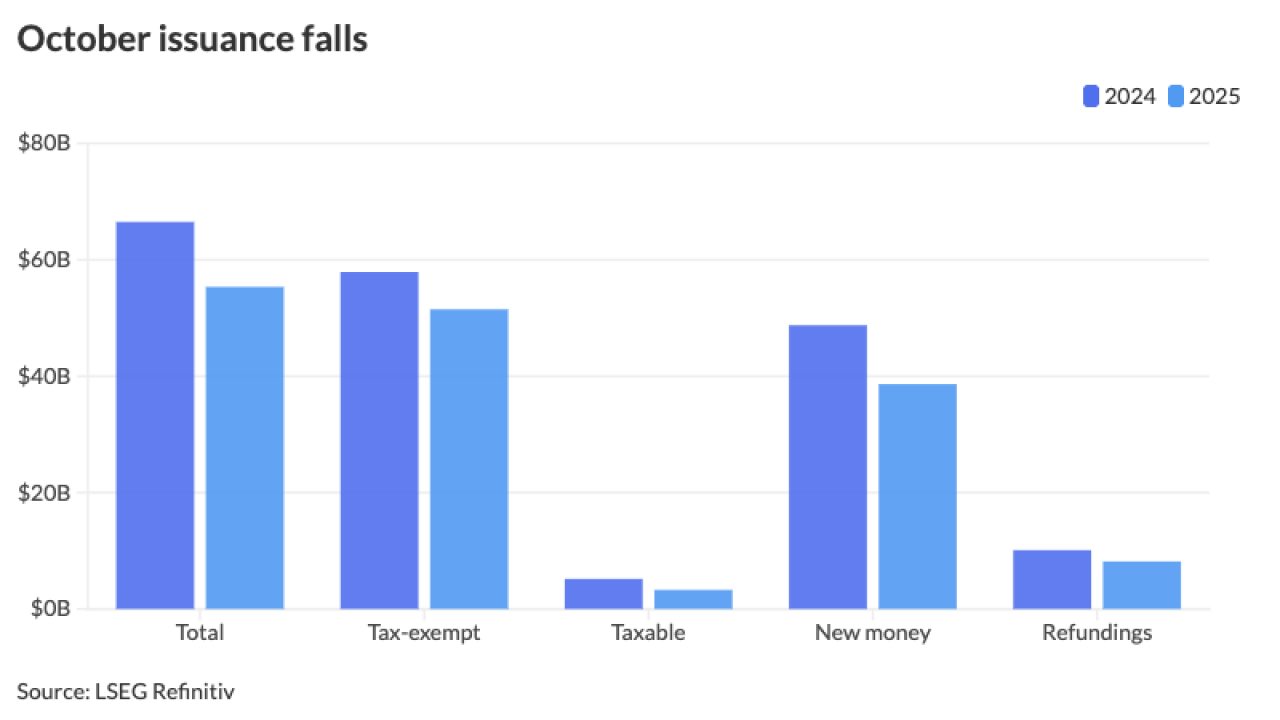
-
Supply is expected to rebound in October, when BofA Securities estimates that issuance will reach $58 billion.
October 1
-
Issuance year-to-date is at $386.689 billion, up 14.9% from $336.478 billion over the same period in 2024.
September 2
-
Dan Hartman of PFM attributed the drop to fewer prepaid gas deals, one-time large transactions last year like Jefferson County's and normal timing variations.
August 21
-
Municipal bond insurance volume grew 12.6% in the first half of 2025 year-over-year, according to LSEG data.
August 18
-
Electric power bond issuance was up 47.8% and educatron issuance was up 31.6% from the first half of 2024.
August 18
-
The market saw elevated issuance, with an average of $10 billion to $12 billion of supply per week.
August 18
-
This is the fourth consecutive month where issuance has topped $50 billion.
August 1
-
Year-to-date volume stands at $310.166 billion, up 17.4% from $264.151 billion at the same time last year, prompting several firms to revisit their supply projections for the year.
July 24
-
The growth of the muni market comes as issuance surges, with the first half of the year seeing $280.64 billion of supply, up 14.3% year-over-year, according to LSEG.
July 3 -
Issuance this year has been "relentless" since the start of the year, while historically the "new-issue machine" takes a while to get rolling, said Scott Diamond, co-head of AM Municipal Fixed Income at Goldman Sachs.
July 1
-
The top five May bond financings totaled more than $5 billion.
June 9
-
Primary bond market volume was up 3.6% year-over-year to $49.9 billion, according to LSEG data.
June 2


