Municipal bond supply will keep on keeping on this week, continuing a boom of issuance that started in August.
This week will mark the third consecutive week with at least $10 billion in projected volume, something that has not happened since the final weeks of 2017, when issuers were racing to get deals done before new tax legislation kicked in.
“Thanks to the back-to-back-to-back big weeks of new issue volume, September borrowing is on track to be the biggest single month since December 2017,” Patrick Luby, senior municipal strategist at CreditSights said. “Including deals that have already come or are expected to be in the market before month-end, this month's prospective total of $40.0 billion would be 61% higher than September 2018 and enough to lift the year to date total to 14% higher than 2018.”

He also said that over the last five years (2014 through 2018), September has on average been only the 10th most active month of the year in new issuance. October having been the most active month of the year.
Prior to this month, the most active month of 2019 was August, when the muni market saw $38.53 billion. The next highest month was June, with $36.33 billion.
Luby noted the municipal bond market shrank by $14.6 billion in par value in the second quarter, according to new data released Friday by the Federal Reserve Board.
“It was the fourth consecutive quarter in which the outstanding par value of the market had contracted, but the aggregate market value increased resulting from the decline in yields over the quarter,” he said. “Households remain the largest individual class of owners in the market, but the share of direct ownership fell from 47% of total market value at the end of the first quarter to 46% at the end of the second quarter.”
Direct ownership includes bonds held in self-directed brokerage accounts as well as in professionally managed accounts such as Separately Managed Accounts, Luby said. Indirect ownership via mutual funds rose from 18% in the first quarter to 19% in the second quarter.
According to the new data published last week by the Federal Reserve Board, broker/dealer holdings of municipal bonds increased by 12% in the second quarter, which correlates with the weekly data on Primary Dealers that is published by the Federal Reserve Bank of New York.
“The increase in Broker/Dealer holdings is significant because it suggests an increased willingness to provide liquidity to the market,” Luby said.
This week’s calendar features 20 scheduled deals of $100 million or more from 19 different issuers. The slate is also front loaded, with the six largest deals all expected to come on Tuesday.
Bank of America is set to price the largest deal of the week, Texas Water Development Board's ( /AAA/AAA) $876.935 million of state water implementation revenue fund master trust taxable bonds on Tuesday.
Wells Fargo is scheduled to price New Jersey's Transportation Trust Fund Authority's (Baa1/BBB+/A-) $800 million of program bonds on Tuesday.
Goldman Sachs is expected to price Providence St. Joseph Health's (Aa3/ /AA-) $650 million of taxable refunding corporate CUSIP bonds on Tuesday.
The largest competitive deal of the week will come from Evergreen School District No. 114, Wash., when it sells $177.30 million of unlimited taxable general obligation bonds on Tuesday.
Secondary market
Munis were mixed on the

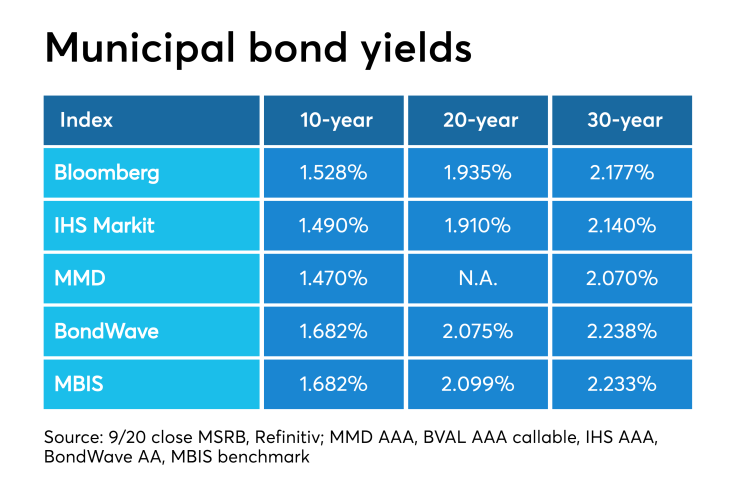
On Refinitiv Municipal Market Data’s AAA benchmark scale, the yield on the 10-year dropped by four basis points to 1.43% and the 30-year muni GO fell by five basis points to 2.02%.
The 10-year muni-to-Treasury ratio was calculated at 83.7% while the 30-year muni-to-Treasury ratio stood at 93.7%, according to MMD.
Treasuries were mostly weaker as stock prices traded in the green. The Treasury three-month was yielding 1.915%, the two-year was yielding 1.685%, the five-year was yielding 1.585%, the 10-year was yielding 1.710% and the 30-year was yielding 2.159%.
Last week's activate traded issues
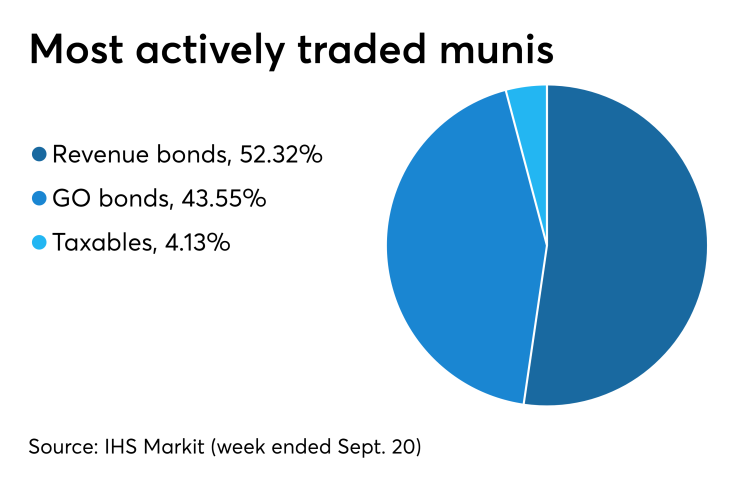
Revenue bonds made up 52.32% of total new issuance in the week ended Sept. 20, down from 52.50% in the prior week, according to

Some of the most actively traded munis by type were from Puerto Rico and Louisiana issuers.
In the GO bond sector, the Commonwealth of Puerto Rico 8s of 2035 traded 30 times. In the revenue bond sector, the St. John the Baptist Parish, Louisiana 2.1s of 2037 traded 48 times. In the taxable bond sector, the GDB Debt Recovery Authority of the Commonwealth of Puerto Rico 7.5s of 2040 traded 25 times.
Previous session's activity
The MSRB reported 27,012 trades Friday on volume of $12.78 billion. The 30-day average trade summary showed on a par amount basis of $10.90 million that customers bought $5.82 million, customers sold $3.22 million and interdealer trades totaled $1.86 million.
New York, California and Texas were most traded, with the Empire State taking 14.869% of the market, the Golden State taking 13.6% and the Lone Star State taking 11.069%.
The most actively traded security was the District of Columbia Tobacco Settlement Financing Corp.’s 0s of 2046, which traded 6 times on volume of $30 million.
Treasury auctions discount rate bills
Tender rates for the Treasury Department's latest 91-day and 182-day discount bills were lower, as the $45 billion of three-months incurred a 1.905% high rate, down from 1.945% the prior week, and the $42 billion of six-months incurred a 1.860% high rate, down from 1.870% the week before.
Coupon equivalents were 1.946% and 1.909%, respectively. The price for the 91s was 99.518458 and that for the 182s was 99.059667.
The median bid on the 91s was 1.880%. The low bid was 1.850%.
Tenders at the high rate were allotted 20.31%. The bid-to-cover ratio was 3.04.
The median bid for the 182s was 1.835%. The low bid was 1.800%.
Tenders at the high rate were allotted 96.97%. The bid-to-cover ratio was 2.77.
Gary E. Siegel contributed to this report.
Data appearing in this article from Municipal Bond Information Services, including the MBIS municipal bond index, is available on The Bond Buyer Data Workstation.


