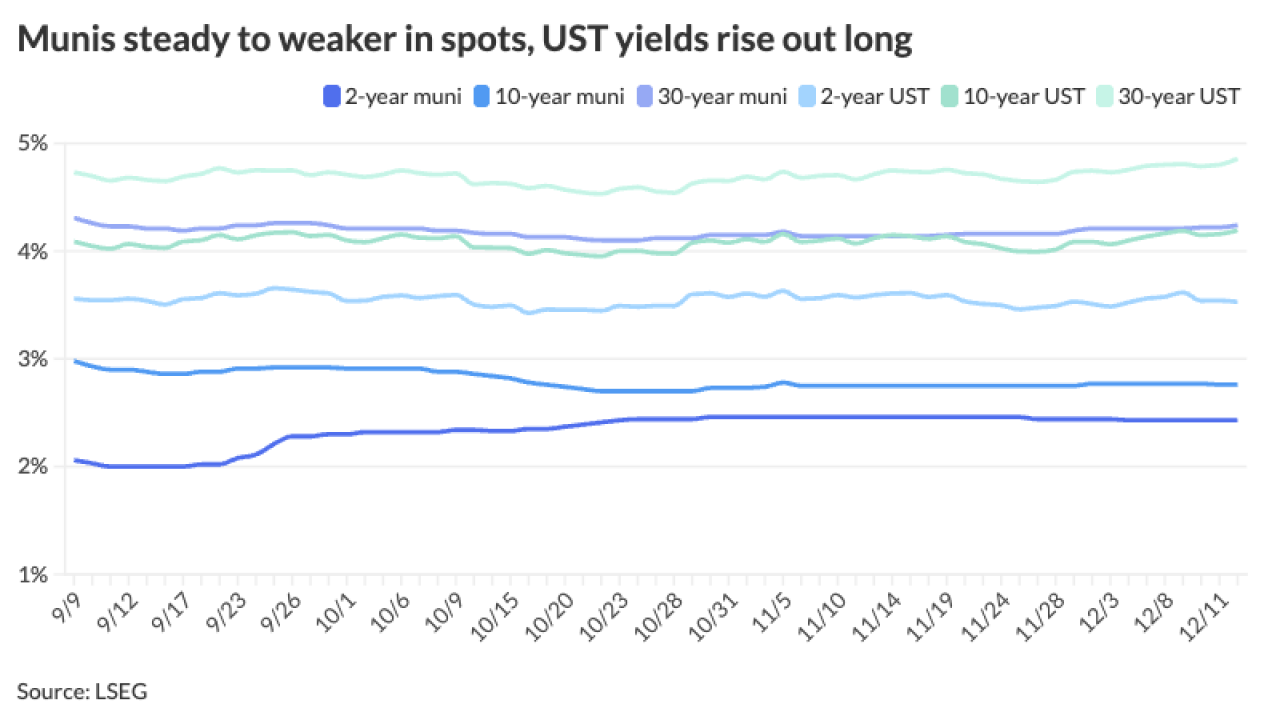
The yield on two-year U.S. Treasury notes was higher than the yield on the 10-year for a while Wednesday, marking the first time since June 2007 this curve has inverted. Many market participants see this as a sign of a coming recession in the next year or two. Other parts of the curve — the 3-month to 10-year and the 2- to 5-year — inverted earlier this year and remain inverted.
“The significant decline in rates has led to meaningful inversion in key parts of the interest rate curve — historically these types of inversions have signaled that economic weakness and a recession is forthcoming over the next 18 months,” according to Brian Rehling, co-head of global fixed income strategy for Wells Fargo Investment Institute. “From a bond market perspective, risks in the market are to the downside.”

Short-term maturities yielding more than longer-term ones “suggests the Fed is behind the curve — but if the Fed is data dependent and the economic data has not yet caught up to markets — so it could be difficult for the Fed to do more than a ‘mid-cycle adjustment’ without data to support a more aggressive stance,” he added.
But when the data catches up to the markets it may be too late. “A key question is if a lower federal funds rate will really even matter — historically low rates and massive [quantitative easing] elsewhere around the globe have not moved the growth needle,” he said.
While there could be “a bit of a bounce,” for the “longer-term trend is clear here and sub 1.00%, perhaps even close to 0% longer-term rates are likely in our future.”
“All that investors really need to know was the bond market's assessment of the economy,” said Charles Self, chief investment officer at iSectors. “Since November 2018, the 10-year Treasury note yield has fallen consistently from 3.25% to 1.60%,” a sign the market believes “the Federal Reserve raised interest rates too high last year to sustain economic growth and that they are behind the curve in dropping interest rates. The further inversion of the curve to the 2-year/10-year continues the template of bond market movements before a recession.”
“Forward-looking indicators, such as manufacturing new orders, aggregate hours worked and gold prices agree with the inverted yield curve that a recession could start within the next six months,” he said.
The inversion “adds one more pressure point for the Federal Reserve to catch up with the free fall in Treasury yields,” according to Mark Heppenstall, chief investment officer at Penn Mutual Asset Management. “If the inversion persists, odds increase of a 50 basis point cut at the upcoming September FOMC meeting. Historical economic signals from the yield curve inversion are blurred by the weakening global economic picture and negative interest rates policies in Europe and Japan.”
While inversion “is an important signal for the future direction of the economy,” John Donaldson, vice president and director of fixed income at Haverford Trust, notes, it’s not “infallible.”
“Every recession in the modern (post-World War II) era has been preceded by an inverted curve. However, not every inversion has presaged a recession,” Donaldson said. “Most typically, an inverted curve occurs because the Fed shoves short-term rates higher than inflation to cool off an economy which is overheating and/or to clean up any excesses which have built up. The objective in that scenario is to make the real cost of money expensive. We certainly do not see any overheating nor any severe excesses. This inverted curve has occurred more because buyers have bid longer maturity bonds to lower yields rather than due to short rates rising.”
He added, current rates are not “limiting the economy. The price of borrowing money today is not going to cause a recession.” And while the chances of recession have risen in the past few weeks, “the base case is for slow growth which avoids a recession. The strength of the consumer, which represents 70% of the economy is still a driving positive force for the economy.”
Jonathan McCollum, director of federal government relations at Davidoff Hutcher & Citron LLP, said while the inversion must be noted, given its historic association with recession, “the two major potential problems I have heard about from business and trade association leaders have been the Federal Reserve’s monetary policy and the threat of tariffs that result in a trade war.”
The Fed’s recent rate cut shows its commitment to prolong the expansion. “With inflation in check and millions of working-age people still jobless, we likely have room to continue growing for some time, especially with both monetary and fiscal policy (consider the recent budget agreement to override spending caps and lift the debt ceiling) stimulus,” he said.
Trade issues eased with the Trump administration’s decision to delay some tariffs on Chinese goods, McCollum said, adding, and “will hopefully contribute to a bilateral deal that avoids retaliatory tariffs and a full-blown trade war.” With a presidential election next year, “I am confident both parties will support trade policies that contribute to, rather than detract from, the current expansion."
Yield curve inversion is a “long-leading indicator,” said Payden & Rygel Chief Economist Jeffrey Cleveland. “Long because a long period can elapse between inversion and a recession. For example, 2s10s inverted in December 2005 and the recession did not begin until December 2007 — a full 24 months.”
The current inversion was, in part, due to two-years rising “(on the hot CPI data) more than 10-year yields (driven more by global concerns, e.g., the low/negative yields in Europe).”
“While there might be reasons to doubt the signal from the U.S. yield curve in current circumstances, it is risky to claim that this time might be different,” noted Silvia Dall’Angelo, senior economist at Hermes Investment Management, in a note Tuesday. “It is true that unconventional monetary policies such as QE and forward guidance have tended to depress the long-end of the curve, implying a low hurdle for the curve to invert. However, when the curve inverted about two years before the onset of the global financial crisis, some observers also pointed out that there were factors depressing the long-end of the curve back then. Hence, the signal from the inverted yield curve cannot be underplayed.”


