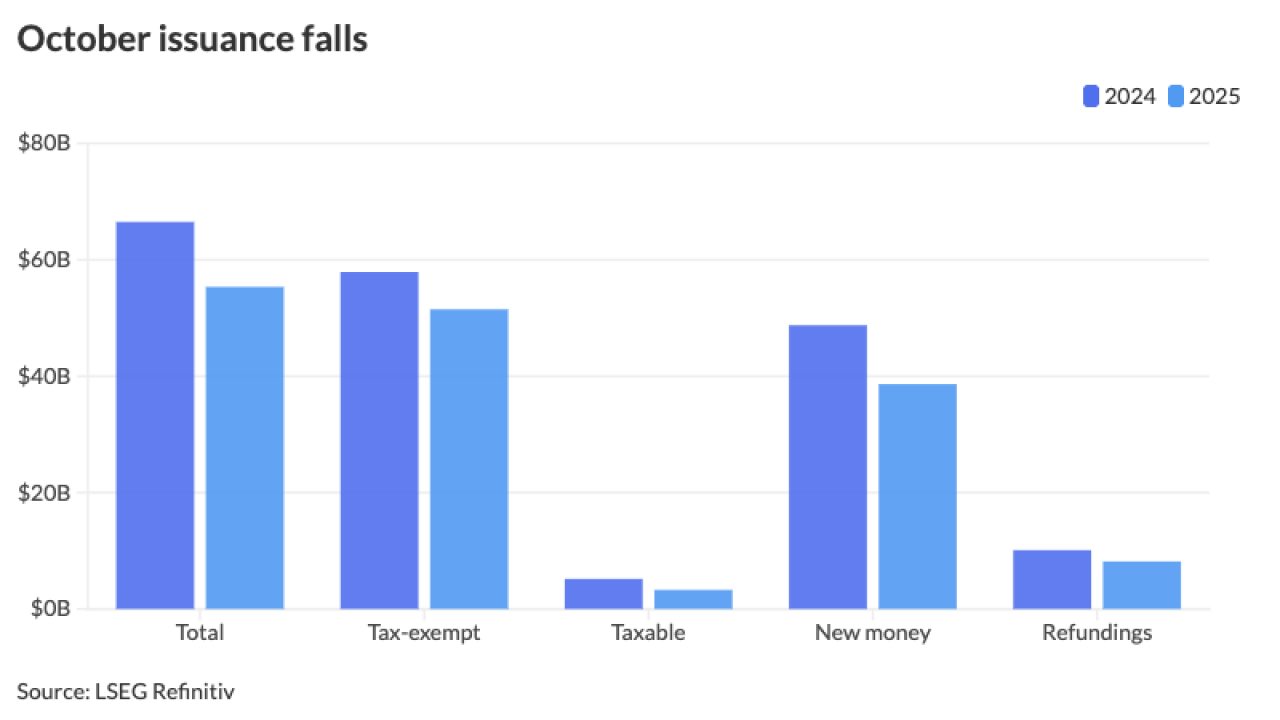
Municipal bond volume ended the first half of 2017 on a positive note, as monthly supply rose in June to the highest so far this year.
Volume rose month-over-month for a third month in a row, spurring optimism among some analysts that new money issuance is helping to offset a decline in refinancings as overall volume drops from last year's record pace.
June volume fell from a year earlier to $36.82 billion in 1,071 transactions from $48.58 billion in 1,491 deals in June of 2016, according to data from Thomson Reuters.

“Although new money issuance fell in June, I’m encouraged that it is still up on the year, since new money most accurately reflects new projects and infrastructure investment,” said Alan Schankel, managing director at Janney Capital Markets.

At midyear, volume stands roughly 14% lower than it was at this point last year. Volume for the year thus far stands at $194.92 billion in 5,611 transactions, down from $226.83 billion in 7,040 transactions.
Concern over “Tax reform put a damper on issuance a little bit during the first half of the year, but I am optimistic on second half supply,” said Dan Heckman, senior fixed income strategist at U.S. Bank Wealth Management. “Especially if we get some interest rate volatility - where issuers will want to get a deal out there sooner rather than later."

He added, “I don’t expect an exact repeat from the second half and in particular the fourth quarter of 2016 but I can see something similar occurring again later this year.”
Monthly volume was bolstered by the second highest weekly output of the year during the week of June 19. Major negotiated deals that priced that week included the $1.1 billion unrated
For the month, refundings sank 47.8% to $10.55 billion in 283 deals from $20.21 billion in 573 deals a year earlier.
“Refundings have been picking up a little bit recently as levels are not far off from where they were at this time last year," Heckman said. "No matter how you slice it, refundings will continue to be well below prior year’s total, although it might pick up in the short term here.”
New money issuance also decreased but not as dramatically, falling 11.4% to $18.78 billion in 705 transactions from $21.19 billion in 797 deals in June 2016.
The value of combined new-money and refunding deals for the month rose to $7.49 billion from $7.17 billion a year earlier. Issuance of revenue bonds declined 10.5% to $23.72 billion, while general obligation bond sales fell 40.7% to $13.09 billion.
Negotiated deals dropped 21.9% to $25.23 billion, and competitive sales decreased by 20% to $10.58 billion.
Taxable bond volume dipped to $2.86 billion from $3.69 billion, while tax-exempt issuance decreased by 25.4% to $32.11 billion. Minimum tax bonds moved up slightly to $1.84 billion from $1.82 billion.
Deals wrapped by bond insurance were down 9.9% year over year to $2.33 billion from $2.59 billion, though Schankel noted that insurance for the month was roughly 6% of total volume, which is a bit higher than its been running.
“This is notable given the S&P negative credit watch on Build America Mutual and National Public Finance Guarantee this month, which was subsequently resolved with no change and stable outlook for BAM, although National, which has had small share of new issuance, was
Development and public facilities were the only two sectors with year-over-year increases. Development was up 37.9% to $1.8 billion and public facilities rose to $1.66 billion from $938 million.
The other eight sectors saw a decrease of at least 4.6%, with electric power posting the biggest drop of 68.8% to $713 million from $2.29 billion. Health care issuance dropped 39.4% to $2.61 billion from $4.31 billion.
As for the different types of entities that issue bonds, only one was in the green. Cities and towns edged 1.5% higher to $6.65 billion from $6.55 billion. Volume for all other entities fell at least a 4.9%, with colleges and universities dropping down 62.5% to $790 million from $2.11 billion. Counties and parishes declined 52.1% to $2.11 billion from $4.42 billion.
The state of California finished the first half as the state with the most combined issuance, a place it has sat in all year. The Golden state has issued $37.74 billion through the first six month of the year. New York is second with $22.75 billion and Texas is not too far behind with $18.76 billion. Pennsylvania is next with $7.70 billion and Wisconsin rounds out the top with $6.85 billion.


