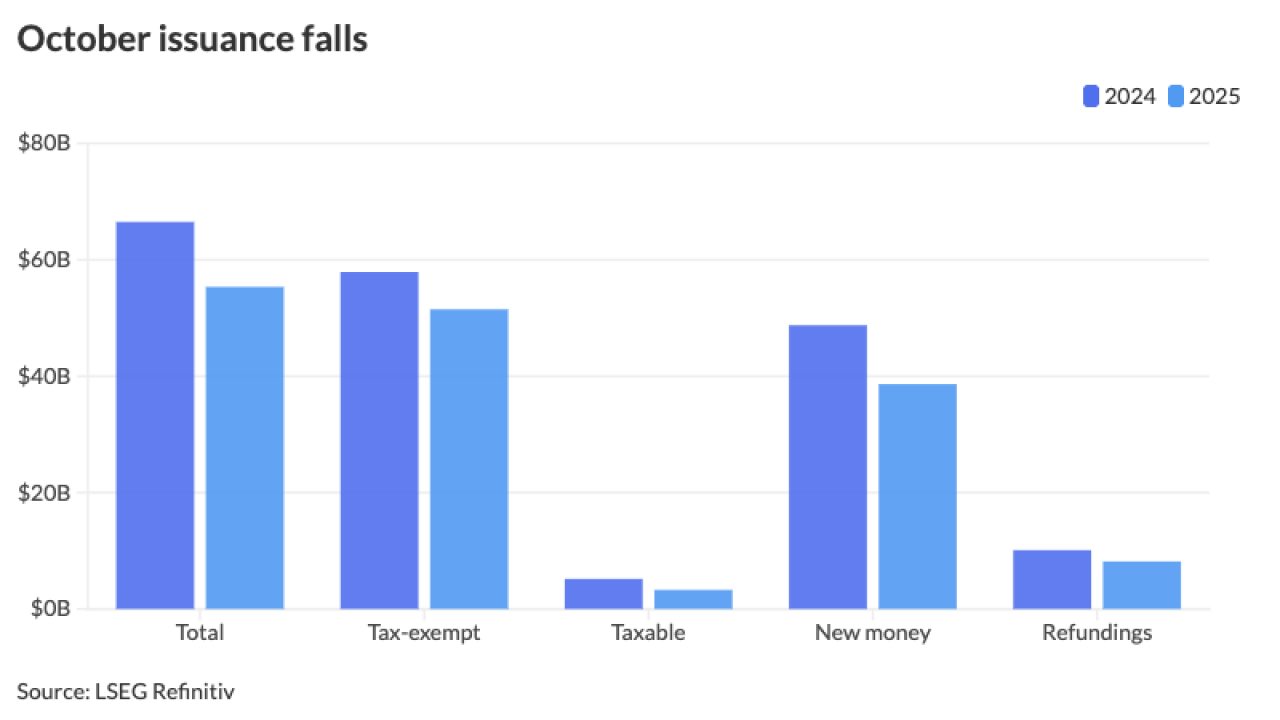
Municipal bond issuance sank 28.2% from April 2018, making it the lowest volume month this year and the slowest start to the second quarter since 2011.
Volume ended the month at $22.62 billion in 673 transactions, down from $31.52 billion in 779 deals a year earlier, according to data from Refinitiv.

"I expected April issuance, like it has in recent years, was going to be the jumping off point for a trend of higher issuance activity, but that was not the case," said Tom Kozlik, director and head of municipal strategy and credit at Hilltop Securities Inc. "Not only was issuance lower in April versus May, but it was one of the lowest months of issuance we have seen in years."
He also noted that May was the sixth month in a row with volume less than $30 billion, the first
time that's happened since May 2014.

Kozlik said he now expects the jumping off point for higher issuance will just occur a month or two later than he thought, perhaps May or June.
"Recent economic data releases pointing to an economy that is not losing air could help," he said. "On the other hand, I have been arguing for some time that issuance has been impacted by credit pressures and perhaps we are starting to see this to be more impactful in issuers
From a big picture perspective, Kozlik said that a higher level of economic growth or an increase in revenues or fees to pay for issuance increases could help persuade decision makers to access the market for upcoming financings sooner rather than later.
Though volume has been down the past two months, the market still ended the first quarter up 18.9% from the same point last year.
"Although May volume should exceed April’s low point, I don’t expect a significant pickup in issuance until we get beyond mid-year budget battles, at which point capital spending and related financing should pick up," said Alan Schankel, managing director and municipal strategist at Janney.

Refunding volume for the month fell 36.4% to $3.29 billion in 116 deals, from $5.05 billion in 133 deals a year earlier. New-money volume dropped 29.5% to $13.14 billion from $18.65 billion.
"The decline in new money borrowing is troubling since new money issuance, which is a key driver of capital and infrastructure investment for state and local government, has been steadily growing post-tax reform, including 2018’s 16% new money increase, despite a 24% year-over-year drop in total volume," said Schankel.
Combined new-money and refunding issuance was 20.8% lower from April 2018 to $6.19 billion, while issuance of revenue bonds fell 26.6% to $13.41 billion and general obligation bond sales dropped 30.5% to $9.22 billion.
Negotiated deal volume slumped by 22.2% to $17.89 billion, while competitive sales dove 30.8% to $4.51 billion.
Taxable bond volume declined 62.9% to $1.41 billion, while tax-exempt issuance crashed 26.3% to $19.08 billion. Issuance of bonds with interest subject to the Alternative Minimum increased 16.4% to $2.13 billion from $1.83 billion.
Deals wrapped by bond insurance for the month was 29.2% higher to $1.49 billion in 120 deals from $1.16 billion in 93 transactions the same time the prior year.
"It is interesting to note that the share of new issues wrapped by bond insurance hit 6% in April, which is higher than recent months as well as last year’s 4.8%," Schankel said.
Three sectors gained from year-earlier levels, while issuance by the rest of the sectors declined at least 6.6%. Healthcare muni sales increased 41.6% to $2.17 billion from $1.54 billion; housing deals nudged up 2.6% to $1.52 billion from $1.48 billion; electric power issuance was up to $388 million from $25 million; and education deals decreased 6.6% to $6.23 billion from $6.67 billion.
"Higher-ed issuance has been falling and continued to do so in April year over year," Kozlik
said. "Credit pressures are definitely influencing higher-ed sector issuance."
No type of issuer increased volume in April, with four out of seven recorded drops of at least 30%. Bond deals by local authorities plummeted 42.4% to $2.94 billion from $5.11 billion. Issuance from state agencies sunk 26.9% to $6.51 billion from $8.90 billion and deals from state governments was 32.8% down to $2.59 billion from $3.86 billion.
California continued to lead all states in terms of muni bond issuance. Issuers in the Golden State have sold $18.68 billion of municipal bonds so far this year; Texas moved up to second with $10.36 billion; New York dropped down to third with $10.34 billion; Florida was next with $5.81 billion; and Massachusetts rounded out the top five with $3.74 billion.
Illinois was next with $3.58 billion, followed by Michigan with $3.27 billion, Pennsylvania with $3.07 billion, then Ohio with $2.62 billion and finishing the top ten is Wisconsin with $2.52 billion.
"I think that May issuance is likely to be higher, even if it is not significantly higher," Kozlik said. "I think that it's likely to start trending up for the year overall."


