-
New issues priced with ease with high-grade issuers tight to triple-A benchmarks. It was the first time the municipal yield curve saw such noticeable movement, following little changed secondary activity for nearly the past two weeks.
January 26
-
The consumer confidence index suggested expectations have slipped, and the Richmond Fed's services survey also offered a dim view ahead.
 November 24
-
Consumers cut back on purchasing plans, suggesting they see a tough fourth quarter, economists said.
 October 27
-
Consumer confidence sputtered even as new home sales surged, highlighting an uneven economic recovery.
August 25
-
With interest rates expected to stay near zero for the foreseeable future, the market expects the Fed to implement yield curve control.
June 30
-
Consumer confidence dropped in March as the economy shut down to prevent the spread of the coronavirus, but economists expected a larger decline.
March 31
-
The Conference Board reported Tuesday that its consumer confidence index improved rose to 130.7 in February.
 February 25
-
Consumer confidence remained high even after a dip this month, and a rate cut by the Federal Reserve could send it higher.
October 29
-
Softness in consumer spending may be ending, which would increase gross domestic product.
May 28
-
The last day of the month brings a host of economic indicators, which showed much good news for housing and labor, strong consumer confidence, but mostly softer manufacturing conditions.
April 30
-
Home prices in 20 U.S. cities slowed in November for an eighth consecutive month, extending the longest streak since 2014, as affordability issues remain.
January 29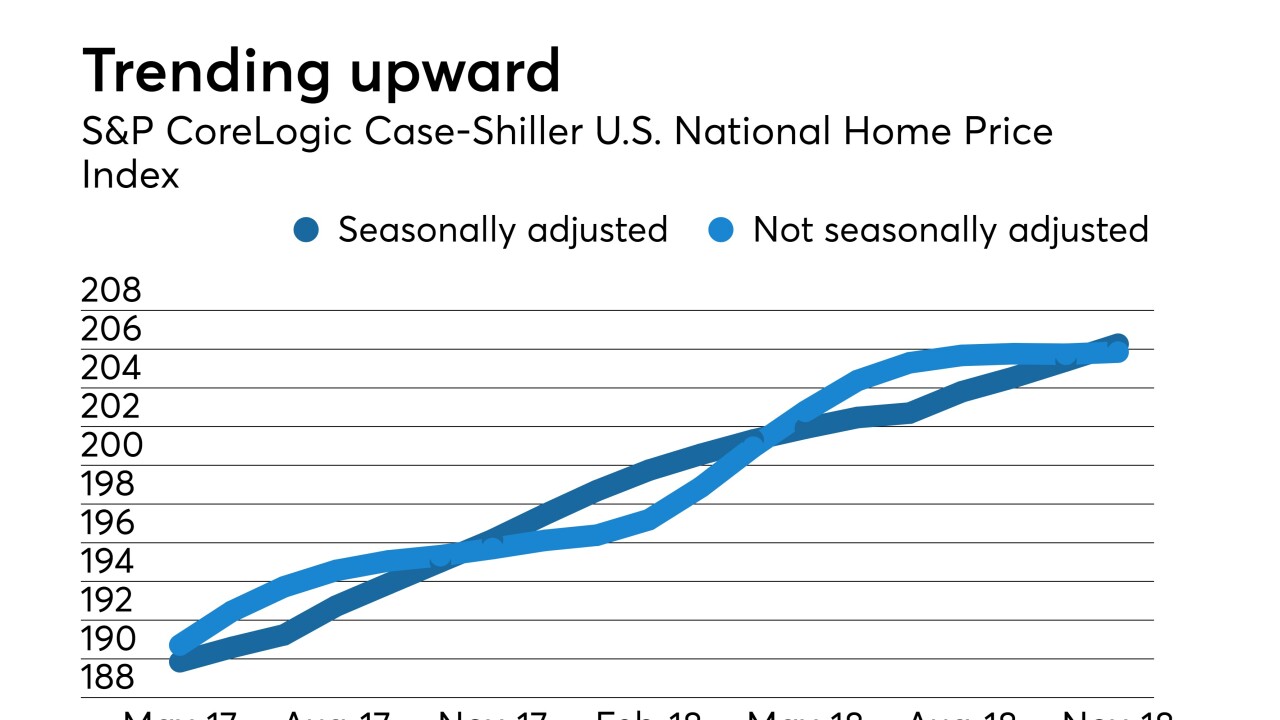
-
Builders’ confidence in the market for new single-family homes grew as the National Association of Home Builders' housing market index rebounded to 58 in January from 56 in December.
January 16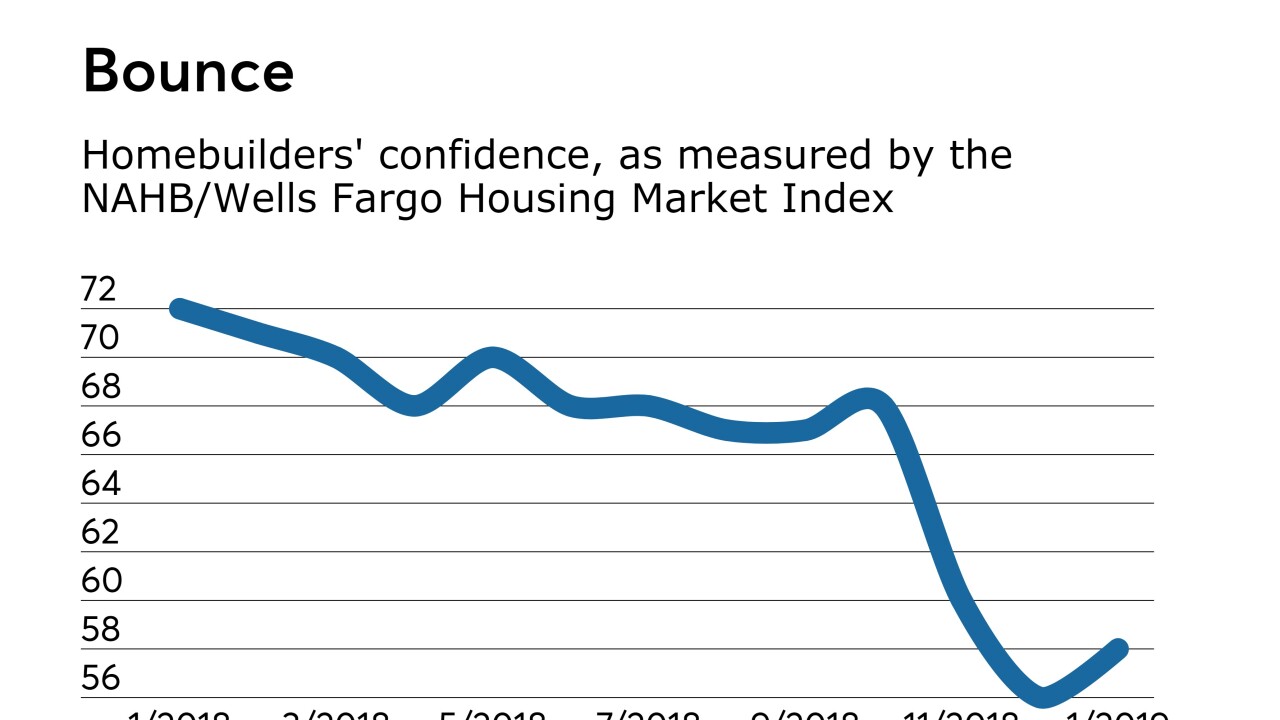
-
Home prices in 20 U.S. cities slowed in October for a seventh consecutive month, extending the longest streak since 2014, a sign of waning demand amid higher mortgage rates and elevated property values.
December 26
-
The S&P CoreLogic Case-Shiller U.S. National Home Price NSA Index reported a 5.8% annual gain in August, down from 6.0% in July.
October 30
-
The S&P CoreLogic Case-Shiller home price index reported a 6.0% annual gain in July, down from 6.2% in June.
September 25 -
Home prices rose 6.5% on an annual basis in March, not seasonally adjusted, according to the S&P CoreLogic Case-Shiller U.S. National Home Price Index, released Tuesday.
May 29
-
Home prices rose 6.3% on an annual basis in February, not seasonally adjusted, according to the S&P CoreLogic Case-Shiller U.S. National Home Price Index, released Tuesday.
April 24
-
Home prices rose 6.2% on an annual basis in January, not seasonally adjusted, according to the S&P CoreLogic Case-Shiller U.S. National Home Price Index, released Tuesday.
March 27
-
Home prices rose 6.2% on an annual basis in November, not seasonally adjusted, according to the S&P CoreLogic Case-Shiller U.S. National Home Price Index, released Tuesday.
January 30
-
Home prices rose 6.2% on an annual basis in September, not seasonally adjusted, according to the S&P CoreLogic Case-Shiller U.S. National Home Price Index, released Tuesday.
November 28


