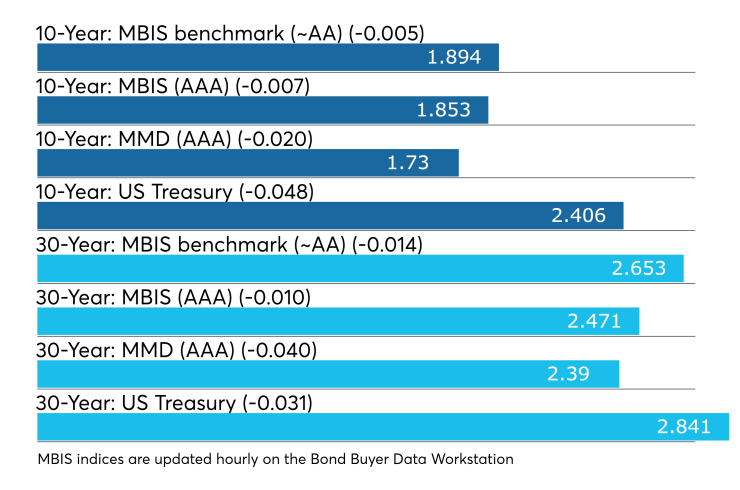
The municipal bond market got even stronger Monday as yields continued to move lower and muni/Treasury ratios decreased ahead of $6.8 billion of new paper that will start to hit screens on Tuesday.
Analysts said the muni market will continue to be dominated by lack of supply and an overabundance of redeemed principal needing to be reinvested, including $35 billion in May and $44 billion in June.
“An enormous wave of cash was unleashed by the $19.4 billion in May 1 redemptions, inundating the money market funds and resulting in the largest one-week jump in assets in over six years,” said Patrick Luby, senior municipal strategist at CreditSights. “Municipal bond mutual funds attracted $1.3 billion in net new assets last week. So far this year there has only been one week with net outflows (the week ended Jan 2.) and only one week when inflows were less than $1 billion ($984 million in the week ended April 10).”
He also noted that muni/Treasury and muni/corporate yield ratios moved lower again last week and, if mutual fund inflows continue, the ratios could go lower still.
“The declines in the 30-year yield ratios are stunning,” he said.
As of May 10, the 10-year muni/Treasury ratio was sitting at 71.1%, while the 30-year was 84.5%. On May 10, 2017, the 10-year was 90.0% and the 30-year was 99.0%.
“Generically, an AAA-rated 10-year muni yielding 1.85% nets a 3.18% taxable-equivalent yield for a 37% federal/5% state tax buyer, and a near-75-basis-point excess yield over 10-year U.S.Treasuries,” said Kim Olsan, senior vice president of muni trading at FTN Financial and contributor to Court Street Group Research. “When filtered down to high-tax states, the taxable-equivalent yield increases another 25 basis points" (in California, the excess yield over USTs is currently 125 basis points).
Primary market
This week’s muni calendar features 12 scheduled deals of $100 million or larger, with four of those coming from the competitive arena.
RBC Capital Markets is set to price the Allegheny County Hospital Development Authority, Pa.’s (A1/A+/A+) $738 million of Series 2019A UPMC revenue bonds on Wednesday.
Proceeds will be used to refund outstanding revenue bonds and notes of the University of Pittsburgh Medical Center, the Allegheny County Hospital Development Authority, the Lycoming County Authority, the Monroeville Finance Authority, and the Dauphin County General Authority.
“The biggest deal of the week should be well received due to the reputation of the flagship institution, size and the potential yields,” Luby said.
He added that year to date, the ICE BofAML Municipal Hospital Securities Index has returned 4.79% (as of May 10), outperforming the Municipal Index which has generated 4.06% so far this year.
“There appears to be some room for credit spread compression because the Option Adjusted Spread for the ICE BofAML A-rated Hospital Index has widened 22 basis points this year, compared to 7 and 3 basis point moves for the AA and BB Indices, respectively,” he said.
Prince George’s County, Md., (Aaa/AAA/AAA) is set to competitively sell $316.805 million of general obligation bonds on Tuesday.
Also, Minneapolis is scheduled to auction off $118 million of GO bonds.
Bank of America is expected to run the books on San Mateo-Foster City Public Financing Authority’s (Aa2/AA-/NR) $226.945 million of wastewater revenue bonds for the clean water program.
Secondary market
Munis were stronger on the

On Refinitiv Municipal Market Data’s AAA benchmark scale, the yield on the 10-year muni GO declined by two basis points and the 30-year muni yield fell four basis points.
Stocks sank further and Treasuries rallied, as China came back with retaliation of higher tariffs.
The 10-year muni-to-Treasury ratio was calculated at 71.9% while the 30-year muni-to-Treasury ratio stood at 84.2%, according to MMD.
Last week's actively traded issues
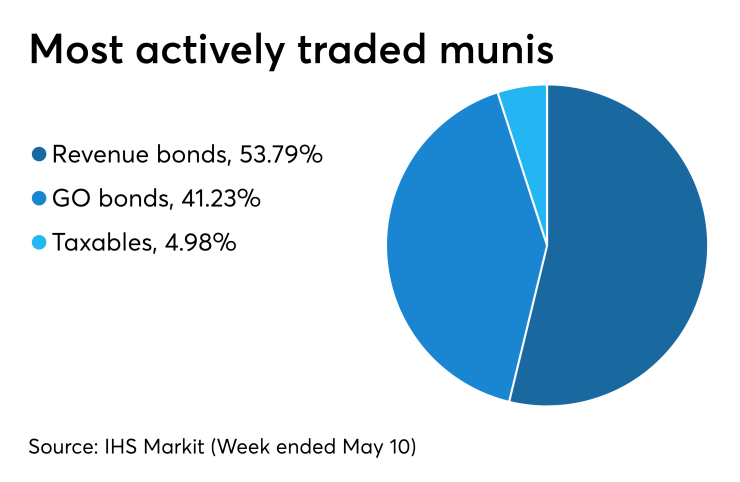
Revenue bonds made up 53.79% of total new issuance in the week ended May 10, up from 52.85% in the prior week, according to

Some of the most actively traded munis by type in the week ended May 10 were from Puerto Rico and Massachusetts issuers.
In the GO bond sector, the Puerto Rico Commonwealth 8s of 2035 traded 23 times. In the revenue bond sector, the Massachusetts Development Finance Agency 4s of 2049 traded 94 times. In the taxable bond sector, the Puerto Rico GDB Bank Debt Recovery Authority 7.5s of 2040 traded 51 times.
Previous session's activity
The MSRB reported 29,460 trades for Friday on volume of $8.094 billion. The 30-day average trade summary showed on a par amount basis of $224.212 million that customers bought $100.31 million, customers sold $138.481 million and interdealer trades totaled $35.978 million.
California, New York and Texas were most traded, with the Golden State taking 15.048% of the market, the Empire State taking 10.448% and the Lone Star State taking 10.036%.
The most actively traded security was the Commonwealth of Puerto Rico 8s of 2035, which traded 24 times on volume of $54.100 million.
Treasury auctions discount rate bills
Tender rates for the Treasury Department's latest 91-day and 182-day discount bills were lower, as the $39 billion of three-months incurred a 2.360% high rate, down from 2.380% the prior week, and the $36 billion of six-months incurred a 2.355% high rate, off from 2.380% the week before.
Coupon equivalents were 2.414% and 2.423%, respectively. The price for the 91s was 99.403444 and that for the 182s was 98.809417.
The median bid on the 91s was 2.340%. The low bid was 2.300%.
Tenders at the high rate were allotted 38.38%. The bid-to-cover ratio was 3.52.
The median bid for the 182s was 2.340%. The low bid was 2.320%.
Tenders at the high rate were allotted 78.64%. The bid-to-cover ratio was 3.26.
Gary E. Siegel contributed to this report.
Data appearing in this article from Municipal Bond Information Services, including the MBIS municipal bond index, is available on The Bond Buyer Data Workstation.


