Municipal bond market participants are seeing the last of this week’s new issues come to market on Thursday, led by issuers from New York and Massachusetts.
Primary market
Jefferies priced the Triborough Bridge and Tunnel Authority’s $159.04 million of Series 2018C general revenues refunding bonds for the New York Metropolitan Transportation Authority’s bridges and tunnels. The deal was offered to retail on Wednesday.
The deal is rated Aa3 by Moody’s Investors Service, AA-minus by S&P Global Ratings and Fitch Ratings and AA by Kroll Bond Rating Agency.
Massachusetts sold $1.5 billion of general obligation revenue anticipation notes in three sales consisting of $500 million each of Series 2018A, Series 2018B and Series 2018C RANs. The financial advisor is Public Resources Advisory Group and the bond counsel is Mintz Levin.
The deal is rated MIG1 by Moody’s, SP1-plus by S&P and F1-plus by Fitch.
JPMorgan Securities received the written award on Illinois’ $965.77 million of Series of September 2018AB GO refunding bonds on Thursday.
The state received bids from 87 institutional investors totaling $4.166 billion in orders, or a 4.3 times subscription for the bonds, the state said.
“We are very pleased with the strong investor response to today’s bond sale. By refunding the $600 million in variable-rate debt, the state eliminates its highest-cost debt and replaces it with traditional fixed-rate bonds carrying a much lower overall rate of interest,” said Illinois Budget Director Hans Zigmund. “By refunding other outstanding bonds with higher fixed rates as part of the same bond sale, we maximized savings and minimized the costs of the sale. Taxpayers will realize these savings for years to come.”
The deal is rated Baa3 by Moody’s, BBB-minus by S&P and BBB by Fitch.
Raymond James & Associates received the official award on the Santa Monica-Malibu Unified School District of Los Angeles County, Calif.’s $120 million of Election of 2012 Series D GOs.
The deal is rated Aaa by Moody’s and AA-plus by S&P.
Wednesday’s bond sales
Illinois
New York
Florida
California
Bond Buyer 30-day visible supply at $8.58B
The Bond Buyer's 30-day visible supply calendar decreased $756.7 million to $8.58 billion for Thursday. The total is comprised of $3.82 billion of competitive sales and $4.77 billion of negotiated deals.
Munis to be supported by limited supply, report says
Strong performance by municipal bonds in the past few months has been fueled by investor risk aversion and reduced supply as compared to 2017 and municipals will continue to be supported by limited supply and strong U.S. macro and credit fundamentals for the remainder of 2018, according to Mark Paris, chief investment officer of municipal portfolio management at Invesco.
Since much of the 2017 supply was originally slated for 2018, municipal issuance is down 20% through the first half of 2018, compared with the same period last year, he said in a report on Wednesday. As a result, total 2018 issuance is projected to reach around $330 billion, compared to $436 billion in 2017, Paris noted.
Their performance hasn’t suffered, however.
“Recently, municipal bonds have performed well despite increased market volatility and a rising interest rate environment that saw the 10-year U.S. Treasury yield breach 3% a number of times this year,” Paris explained.
The Bloomberg Barclays Investment Grade Municipal Bond Index has returned 0.49% and the corresponding high yield index has returned 1.07%, quarter-to-date, according to the Invesco report.
“We believe this strong muni performance was due in part to investor risk aversion that has benefitted both municipal bonds and Treasuries as well as a reduction in muni supply following the 2017 tax reform,” Paris wrote.
Uncertainty about the implementation of the Tax Cuts and Jobs Act (TCJA) created concerns for municipal bond issuers and new policies resulted in a late 2017 supply surge in the midst of uncertainty around the elimination of tax-exempt private activity bonds, which were spared in the final bill, and advance refundings, which were ultimately eliminated, he pointed out.
As a result, muni supply during the fourth quarter of 2017 — boosted by December’s $62.5 billion of new issuance alone — was the highest it has been in the 32 years that these data have been recorded, Paris noted.
Secondary market
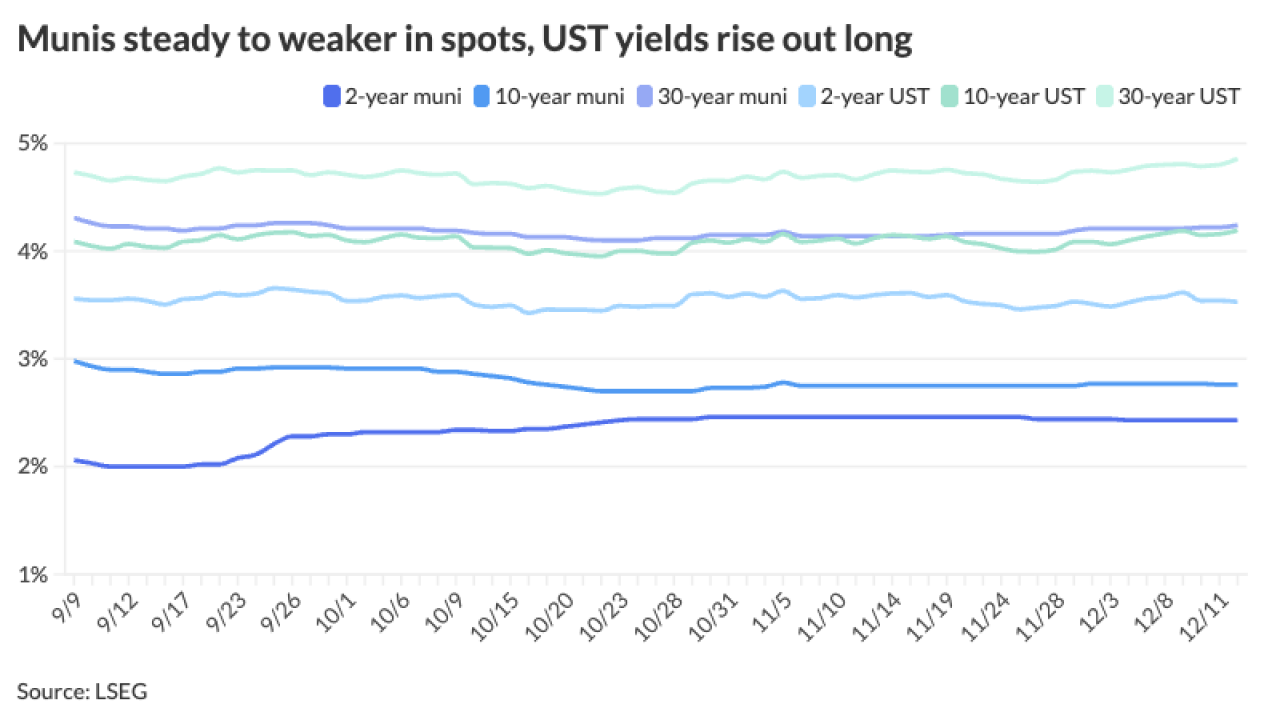
Municipal bonds were mixed on Thursday, according to a midday read of the MBIS benchmark scale. Benchmark muni yields fell less than one basis point in the seven- to 11-year and 18- to 22-year maturities, rose less than a basis point in the one- to six-year, 14- to 16-year and 27- to 30-year maturities and remained unchanged in the 12- and 13-year, 17-year and 23- to 26-year maturities.
High-grade munis were also mixed, with yields calculated on MBIS’ AAA scale falling as much as three basis points in the eight- to 30-year maturities and rising five basis points in the one year maturity and rising as much as one basis point in the two- to seven-year maturities.
Municipals were steady on Municipal Market Data’s AAA benchmark scale, which showed the yield on both the 10-year muni general obligation and the yield on 30-year muni maturity remaining unchanged.
Treasury bonds were stronger as stock prices moved lower.
On Wednesday, the 10-year muni-to-Treasury ratio was calculated at 86.5% while the 30-year muni-to-Treasury ratio stood at 100.3%, according to MMD. The muni-to-Treasury ratio compares the yield of tax-exempt municipal bonds with the yield of taxable U.S. Treasury with comparable maturities. If the muni/Treasury ratio is above 100%, munis are yielding more than Treasury; if it is below 100%, munis are yielding less.
Previous session's activity
The Municipal Securities Rulemaking Board reported 41,236 trades on Wednesday on volume of $11.97 billion.
California, Texas, and New York were the municipalities with the most trades, with Golden State taking 12.474% of the market, the Lone Star State taking 15.949% and the Empire State taking 11.057%.
ICI: Long-term muni funds saw $662M inflow
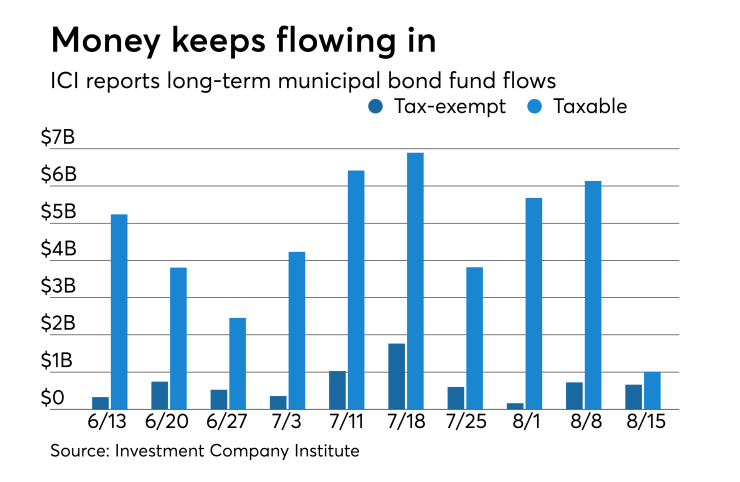
Long-term tax-exempt municipal bond funds saw an inflow of $662 million in the week ended Aug. 15, the Investment Company Institute reported.
This followed an inflow of $723 million into the tax-exempt mutual funds in the week ended Aug. 8 and inflows of $163 million, $600 million, $1.765 billion, $1.028 billion, $356 million, $525 million, $742 million, and $326 million in the eight prior weeks.

Taxable bond funds saw an estimated inflow of $1.013 billion in the latest reporting week, after seeing an inflow of $6.135 billion in the previous week.
ICI said the total estimated inflows to long-term mutual funds and exchange-traded funds were $301 million for the week ended Aug. 15 after inflows of $3.292 billion in the prior week.
Tax-exempt money market funds saw inflows
Tax-exempt money market funds saw inflows of $678.6 million, raising total net assets to $129.49 billion in the week ended Aug. 20, according to The Money Fund Report, a service of iMoneyNet.com. This followed an outflow of $1.35 billion to $128.81 billion in the prior week.
The average, seven-day simple yield for the 201 weekly reporting tax-exempt funds rose to 1.06% from 0.96% the previous week.
The total net assets of the 832 weekly reporting taxable money funds rose $9.0 billion to $2.696 trillion in the week ended Aug. 21, after an outflow of $8.98 billion to $2.687 trillion the week before.
The average, seven-day simple yield for the taxable money funds increased to 1.58% from 1.57% from the prior week.
Overall, the combined total net assets of the 1,033 weekly reporting money funds rose $9.68 billion to $2.825 trillion in the week ended Aug. 21, after outflows of $10.33 billion to $2.816 trillion in the prior week.
Treasury announces auction details
The Treasury Department announced these auctions:
- $31 billion of seven-year notes selling on Aug. 29;
- $37 billion of five-year notes selling on Aug. 28;
- $36 billion of two-year notes selling on Aug. 27;
- $17 billion of one-year 11-month floating rate notes selling on Aug. 29;
- $45 billion of 182-day bills selling on Aug. 27; and
- $51 billion of 91-day bills selling on Aug. 27.
Gary Siegel contributed to this report.
Data appearing in this article from Municipal Bond Information Services, including the MBIS municipal bond index, is available on The Bond Buyer Data Workstation.


