A slight inversion of the two-year Treasury note didn't concern analysts, who offered explanations related to the Federal Open Market Committee statement suggesting rates will stay near zero for quite a while and a focus on the long end.
The two-year Treasury inverted relative to the one-year and six-month Treasuries on Thursday.
Gary Pzegeo, head of fixed income at CIBC Private Wealth Management, said he wouldn’t attach very much significance to this. “The current yield gap is less than one basis point and it occurs within the context of yesterday’s release of the [Summary of Economic Projections], where the median rate projection is flat through the end of 2022,” he said. “It could be due to the increase in Treasury supply required to fund the COVID-19 recovery effort and the fact that demand for Treasuries from the Federal Reserve does not include T-bills for the moment. The greater marginal demand for notes, beginning with the two-year, may be enough for this small yield curve distortion.”
"Long-dated global bond yields fell off a cliff," noted Edward Moya, senior market analyst at OANDA. “U.S. Treasury markets are focusing on the long end as investors believe Fed Chair [Jerome] Powell is nowhere near considering a rise with interest rates,” Moya said. “Some investors feel the best opportunities start with five-year Treasury as anything less than two years is pretty much locked down. The 10-year Treasury yield can kiss 1% goodbye as risks to the outlook will keep Powell dovish for the rest of the year.”
Initial claims
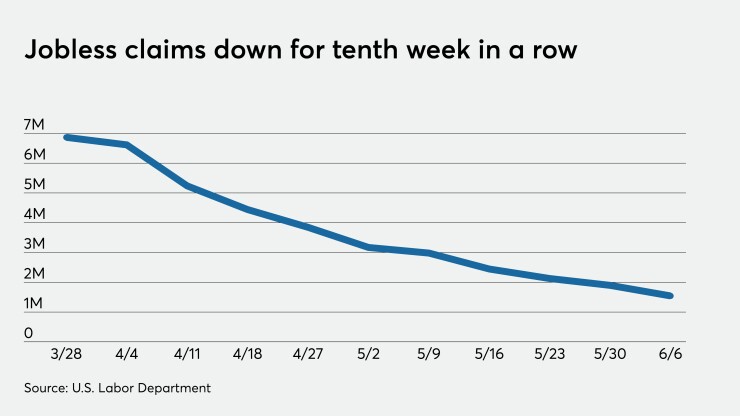
Initial jobless claims fell to a seasonally adjusted 1.542 million in the week ended June 6, from the previous week’s upwardly revised level of 1.897 million, originally reported as 1.877 million, the Labor Department said Thursday.

Economists polled by IFR expected 1.525 million claims in the week.
"As the COVID-19 pandemic continues to claim devastating tolls in lives and lost economic output, the elevated level of new jobless claims at 1.5 million serves as a reminder that this two-sided crisis is very much persisting,” said Mark Hamrick, senior economic analyst at Bankrate.com. “New claims have topped 1 million for 12 straight weeks. That’s in contrast to fewer than 300,000 new claims in mid-March before the crisis took hold."
Continued claims for the week ended May 30 totaled 20.929 million, a decline from the prior week’s downwardly revised 21.268 million, first reported as 21.487 million.
Economists anticipated 20.000 million continued claims.
"As we look for signs that the worst of the downturn might be behind, new claims have declined for 10 straight weeks along with a drop in continuing claims,” Hamrick said. “But the situation remains dire with the nation’s unemployment rate in the double-digits and joblessness disproportionately affecting women, Blacks, Hispanics and teenagers."
The states with the largest increases in claims in the week were Florida (32,296), California (25,372), Oklahoma (16,662), and Mississippi (158), while those with the biggest declines were New York (107,161), Michigan (25,284), Texas (21,040), Pennsylvania (18,050), and Washington (17,507).
"Stock futures are sharply lower this morning reminding us that volatility has not gone away even with all of the remarkable measures put in place by the Federal Reserve and economic relief measures passed by elected officials in Washington, even as they consider another round of legislation,” Hamrick said. “For the economy, Americans’ personal finances and the situation with the virus itself, we still have a long road ahead of us."
PPI
The producer price index rose 0.4% in May, a 1.3% decline in April and down 0.2% in March, the Labor Department reported on Thursday.
Economists predicted it would rise 0.1%.
Year-over-year PPI fell 0.8%, compared to economist's expectations of a 1.3% drop.
Excluding food and energy PPI dipped 0.1% in the month, after a 0.3% decline a month earlier.
Economists anticipated the index would be 0.1% lower.


