Want unlimited access to top ideas and insights?
The municipal market saw yields fall by five to six basis points across the curve and strong secondary high-grade trades showed it. Municipals are poised to gain well over 2.5% for the month and return to positive territory for the year after being pummeled at the start of the coronavirus-led sell-off in March.
According to the Bloomberg Barclays Index, municipals will see 2.7% returns since the beginning of the month, the largest one-month return since 2009.

Municipal to U.S. Treasury ratios are still driving yields lower. The 10-year muni-to-Treasury ratio was calculated at 127.1% while the 30-year muni-to-Treasury ratio stood at 120.1%, according to Refinitiv MMD.
The 10-year muni-to-Treasury ratio was calculated at 127.1% while the 30-year muni-to-Treasury ratio stood at 120.1%, according to ICE Data Services.
The 10-year IHS Markit Municipal Analytics Curve yield was at 1.15% on Jan 31, 2020 and the muni-to-Treasury ratio was at 76%.
When COVID fears hit in March 2020, yields rose with the 10-yield touching 2.81% on March 20, 2020 with the Muni/UST ratio at 302%. Since then muni yields have compressed and as at May 21, 2020 the 10-year yield has come to 0.94% (below 1%) and the muni/UST ratio at 138% by IHS Markit's data.
"So yes, muni yields have come closer to 1% but relative to Treasuries, they are still cheaper compared to what they were at the end of January 2020," said IHS Markit's Tozar Gandhi. "I believe the recent heavy interest in short-term municipal paper is driven primarily on account of access to municipalities and agencies to the Fed's the Municipal Liquidity Facility as well as higher Muni/UST ratios along with very negligible yields in the one-to five-year maturities."
Treasuries are a few basis points lower, led by the 20-year which was down three basis points. The three-month to 30-year UST curve stands at 124 basis points, three basis points flatter than Thursday, according to MMD.
More muni volume is transacting in spread to U.S. Treasuries rather than spread to the benchmark AAA curves where a newer set of buyers is concerned, sources said.
Out of the gates Friday morning, high-grades were again moving benchmarks.
Washington GOs, 5s of 2021, traded at 0.20%. Metropolitan Water Authority of Southern California waters 5s of 2022 traded at 0.20%. Meanwhile Indiana Finance Authority green bonds, 5s of 2022, traded at 0.18%. Prince Georges Maryland GO 5s of 2022 traded at 0.19%.
Loudon County, Virginia 5s of 2023 traded at 0.33%. Chesapeake Virginia 5s of 2027 traded at 0.69%-0.68% after trading at 0.75% yesterday. Another Loudon County traded, 5s of 2027, stood at 0.75%-0.74%.
Investor inquiry is going further out the curve for more yield as this rally continues.
Washington GOs, 5s of 2034, traded at 1.30%. On Wednesday, they were at 1.44%-1.41%.
Delaware GOs, 2s of 2035, were at 1.95%-1.91%.
Northside, Texas ISD 4s of 2041 traded at 1.50%-1.44%. Thursday they traded at 1.52%-1.40%.
New York City TFAs, 5s of 2041, traded at 2.06%-2.05%. Thursday they traded at 2.11%-2.10%. Originally priced at 2.37%.
Northside Texas ISD 3s of 2047 traded at 2.23%-2.22% and on Tuesday traded at 2.28%-2.15%.
The primary supply for the holiday-shortened week is smaller at a little more than $4 billion of a mix of exempt and taxable issuance led by the state of Colorado’s (Aa2/AA-//) $500 million of certificates of participation in a deal led by BofA Securities.
Connecticut is back in the market with $500 million of taxable general obligation bonds
The State of Wisconsin also has a day-to-day $200 million of taxable refunding bonds led by Wells Fargo Securities.
On the competitive side, highly rated Loudon County Economic Development Authority, Virginia has a $268 million competitive serial deal set for Thursday.
The New York City Housing Development Corporation (Aa2/AA+/NR/NR) has a $181 million sustainable development bond deal led by JP Morgan Securities.
Issues out of Texas continue with another housing deal from the Texas Department of Housing and Community Affairs (Aaa/AA+//) with $175 million of non-AMT single-family mortgage revenue bonds with serials from 2021-2031 and terms in 2035, 2040, 2045, 2050 led by RBC Capital Markets.
Another A+ rated California issuer is coming with $152 million of taxable pension obligation bonds led by Cabrera Capital Markets, LLC.
New Jersey Economic Development Authority (A1/A+/NR/NR) will sell $150 million of New Jersey-American Water Company, Inc. Project water facilities refunding revenue bonds on Thursday led my JP Morgan.
And Guam Waterworks Authority (Baa2/A-/NR/NR) $134 million of water and wastewater system revenue bonds are planned for Thursday led by Citi.
Secondary market
Municipals ended a holiday-shortened trading session on a strong note as yields continued to drop all along the curve.
Markets finished trading early Friday and remain closed through the Memorial Day weekend. Trading resumes Tuesday, May 26.
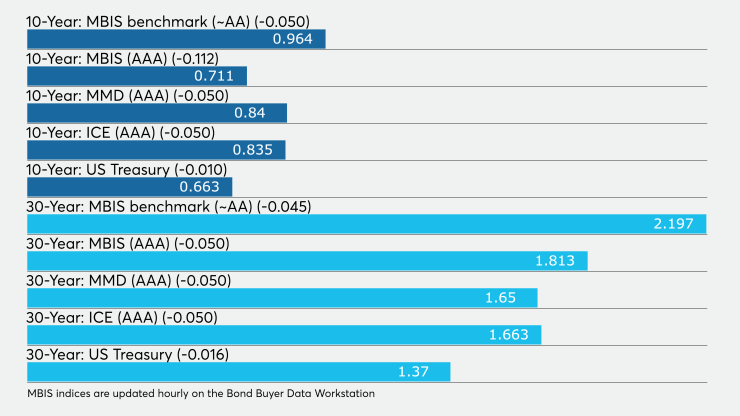
On Refinitiv Municipal Market Data’s AAA benchmark scale, yields dropped by five basis points, to 0.12% in 2021, 0.18% in 2022 and 0.25% in 2023. Out longer, the yield on the 10-year GO fell five basis points to 0.84% while the 30-year was off five basis points to 1.65%.
The 10-year muni-to-Treasury ratio was calculated at 127.1% while the 30-year muni-to-Treasury ratio stood at 120.1%, according to MMD.
The ICE AAA municipal yield curve also showed maturities declining, with the 2021 maturity off four basis points to 0.140%, the 2022 down four basis points to 0.189% and the 2023 maturity down five basis points to 0.254%. The 10-year yield was off five basis points to 0.835% while the 30-year was down five basis points to 1.663%.
The BVAL curved showed the 2021 maturity fall five basis points to 0.08% and the 2022 at 0.14%. BVAL also showed the 10-year muni fall five basis points to 0.82% while the 30-year fell another five to 1.69%.
Munis were also stronger on the MBIS benchmark scale, with yields falling in the 10- and 30-year maturities.
Treasuries strengthened as equities traded mixed.
The three-month Treasury was yielding 0.117%, 10-year Treasury was yielding 0.663% and the 30-year was yielding 1.370%.
The Dow was off 0.43%, the S&P 500 was down 0.10% and the Nasdaq was up 0.19%.
Lipper reports $1.8B inflow
Investors remained bullish on municipal bonds and continued to put cash into bond funds in the latest reporting week.

In the week ended May 20, weekly reporting tax-exempt mutual funds saw $1.840 million of inflows, after inflows of $581.943 million in the previous week, according to data released by Refinitiv Lipper Thursday.
Exchange-traded muni funds reported inflows of $605.643 million, after inflows of $199.031 million in the previous week. Ex-ETFs, muni funds saw inflows of $1.234 billion after inflows of $382.912 million in the prior week.
The four-week moving average turned positive at $189.374 million, after being in the red at $252.099 million in the previous week.
Long-term muni bond funds had inflows of $1.916 billion in the latest week after outflows of $39.032 million in the previous week. Intermediate-term funds had inflows of $138.070 million after inflows of $184.283 million in the prior week.
National funds had inflows of $1.277 billion after inflows of $661.757 million while high-yield muni funds reported inflows of $773.521 million in the latest week, after outflows of $293.599 million the previous week.
“There have been 10 outflow cycles since 1992 and this particular one is following the cycle. Outflows in this cycles were caused by pressured selling in larger mutual fund/ETFs with started in high-yield and moved into investment-grade quickly, and then included SMA managers,” says Dan Scholl, Head of Municipal Fixed Income at Wilmington Trust. “We saw rapid outflows (over $30 billion) and have settled into outflows that are much less than and include weeks that are positive. Cycles follow similar patterns in that you see rapid outflows, then periods of mini rallies and sell-offs, until prices stabilize and inflows persist over longer time-frames. Most outflow cycles have lasted 36 weeks or so, but some have lasted much longer.”
He said this cycle would be affected by the pandemic and the responses to it.
“The trajectory of the COVID-19 crisis and the continued responses by federal, state and local governments to the revenue and operational challenges will weigh heavily on the length of this outflow cycle as well as investor comfort levels in municipals as a relatively safe asset class,” he said.
He added that this time was unlike situations seen in the past.
“This particular cycle is different in that the federal government entered very quickly through Congressional action, and expanded Federal Reserve authority to buy municipals and the creation of the MMLF as a continued backstop to the municipal market,” Scholl said.
Bond Buyer indexes weaken
The weekly average yield to maturity of the Bond Buyer Municipal Bond Index, which is based on 40 long-term bond prices, dropped four basis points to 3.80% from 3.84% the week before.
The Bond Buyer's 20-bond GO Index of 20-year general obligation yields fell 11 basis points to 2.37% from 2.48% in the previous week.
The 11-bond GO Index of higher-grade 11-year GOs decreased 11 basis points to 1.90% from 2.01% the prior week.
The Bond Buyer's Revenue Bond Index declined 11 basis points to 2.79% from 2.90% from the previous week.
The yield on the U.S. Treasury's 10-year note rose to 0.68% from 0.63% the week before, while the yield on the 30-year Treasury increased to 1.40% from 1.31%.


