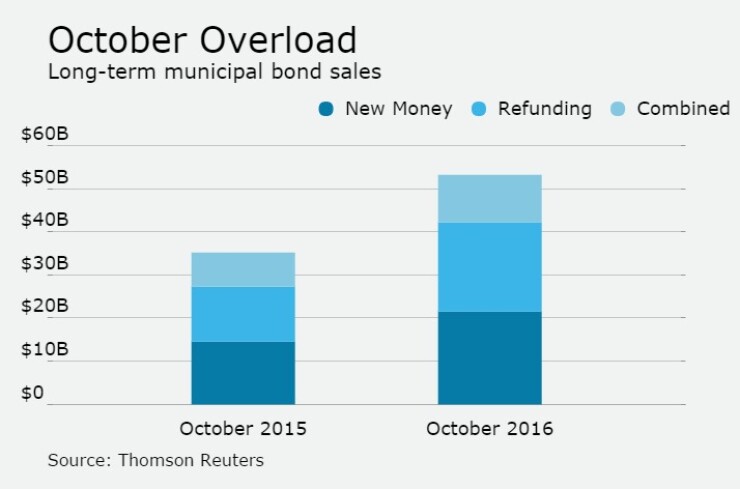

Monthly municipal bond volume surged to a three-decade high in October, as issuers rushed to take advantage of near-record low interest rates and get deals done before the presidential election.
October bond issuance totaled $53.16 billion, according to Thomson Reuters, the most in digital records going back to 1986 and surpassing the $50.79 billion total set in June 2008. The last time volume was higher was in December 1985, when it hit $59 billion, according to Bond Buyer yearbooks.
"We had three weeks of exceptionally large issuance and there were a couple of factors driving issuers into the market,"said Jim Grabovac, senior portfolio manager at McDonnell Investment Management. "You have the presidential election plus an increasing probability the Federal Reserve will raise rates again in December."
Volume for the month was up 51.4%, from $35.12 billion in the same month last year. Issuance for the year-to-date is $339 billion, meaning volume is likely to surpass the $400 billion plateau for the second year in a row and could also challenge the yearly record of $433.3 set back in 2010.
"The volume is explainable, as concerns about rising interest rates and getting in ahead of the election, pushed issuers into the market," said Natalie Cohen, managing director of municipal securities research at Wells Fargo Securities. "For the year through October there were 25 deals larger than $500 million and 200 deals larger than $100 million – much of which occurred on October. In October alone, there were 21 deals over $500 million and 126 over $100 million."
New money sales increased by almost half to $21.62 billion in 575 deals from $14.49 billion in 489 deals a year earlier, fueling expectations that demand for infrastructure improvement will propel muni sales in the months ahead.
"Looking ahead, if there's any testimony to the hope that bi-partisan agreement provides, look at transportation," Cohen said. "At the end of 2015 Congress finally passed a longer term, five-year highway and transit bill. At this time there are more than $250 billion ballot measures related to transportation in the November election. Those that pass will create jobs and be good for economic growth."
Refundings, which have been strong for most of the year due to persistent low interest rates, catapulted 60.2% higher to $20.54 billion in 451 transactions. from $12.82 billion in 397 transactions during the same period last year.
"Refundings are great for issuers because they help with balance sheets and cash flows," Cohen said.
Issuance was also helped by a correction in market yields over the past several weeks, according to Grabovac.
"We have seen a fairly decent correction, as a higher supply turned into a 25 basis point or so backup in yields, which is something that participants were wanting, and now I think we are at a comfortable level," he said.
Combined new-money and refunding issuance climbed 41% to $11 billion from $7.81 billion.
Negotiated deals, at $43.22 billion, were higher by 76.3%, while competitive sales increased by 8.6% to $9.25 billion from $8.52 billion.
Issuance of revenue bonds increased 54.5% to $35.85 billion, while general obligation bond sales gained 45.3% to $17.32 billion.
Taxable bond volume was 18.9% higher at $2.92 billion, while tax-exempt issuance increased by 64.9% to $49.66 billion.
Minimum tax bonds issuance slipped to $587 million from $2.55 billion, while private placements sank to $691 million from $2.08 billion.
Zero coupon bonds increased to $240 million from $98 million.
Bond insurance increased 52.6% for the month, as the volume of deals wrapped with insurance rose to $2.69 billion in 169 deals from $1.76 billion in 154 deals.
Variable-rate short put bonds inclined 30% to $1.09 billion from $841 million. Variable-rate long or no put bonds rose to $115 million from $2100 million.
Bank qualified bonds improved 11.4% to $1.88 billion from $1.69 billion.
Five out of the 10 sectors saw year-over-year gains. Health care more than doubled to $7 billion from $2.93 billion, general purpose also saw a more than double increase to $14.84 billion from $7.21 billion, education related more than doubled as well at $13.31 billion from $6.71 billion, hosing increased 23.7% to $1.99 billion from $1.61 billion and utilities improved 45.2% to $6.93 billion from $4.77 billion. The other sectors all saw at least 6.2% decrease.
California is still the top issuer among states for the year to date, followed by Texas, New York, Pennsylvania and Florida.
Issuance from the Golden State so far this year has totaled $57.38 billion, with the Lone Star State next at $48.44 billion. The Empire State follows with $39.49 billion. The Keystone State is in fourth with $18.49 billion and The Sunshine State rounds out the top five with $16.23 billion.
"Going forward, there should be more infrastructure spending, which will also create more jobs and will be good for the economy as a whole," said Cohen. "New money projects are much lower than 2010 but we are starting to see it come back and that is a good sign for infrastructure."


