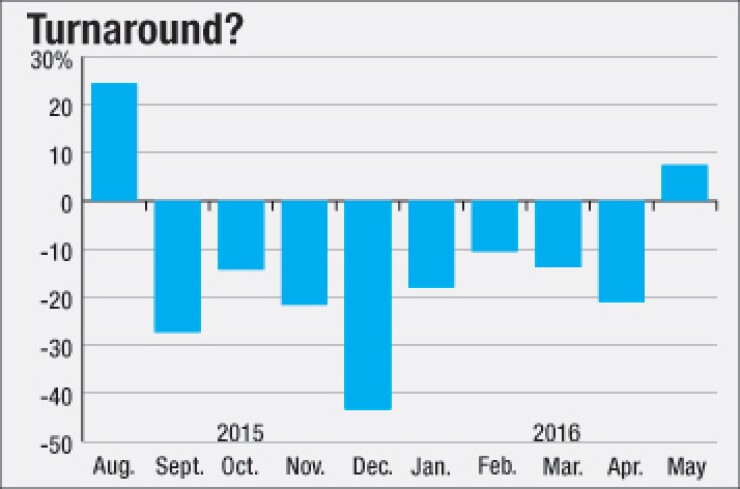

After an eight month streak of declines in year-over-year volume, municipal bond issuance rose in May as both new money and refunding deals increased.
Total monthly volume increased 7.5% to $39.63 billion in 1,201 transactions from $36.85 billion in 1,302 transactions in May 2015, according to data from Thomson Reuters.
Refundings improved 15.8% to $15.22 billion in 481 deals, up from last May's $13.15 billion in 470 deals.
New-money deals rose 14.8% to $16.71 billion in 621 issues compared to $14.56 billion in 715 issues.
"The good news is, is that new money issuance continues to show signs of life – very healthy for the market," said Chris Mauro, director of municipal bond research at RBC Capital Markets. "We are finally starting to see some traction on the new money side."
Mauro said that it was around this time last year that volume started to soften in volume, however, and the rest of this year is likely to be similar because of concerns over interest rates.
Tom Kozlik, a managing director and municipal strategies at PNC Capital Markets said the most notable trend is that issuance through the first five months of the year is lagging behind last year's pace.
"We are currently at around $172 billion right now and this time last year, we were at $186 billion," Kozlik said. "New money issuance restraint will continue as issuers stay mindful of their credit profiles."
Kozlik's issuance forecast for 2016 was somewhere between $325 billion and $375 billion, and he still expects issuance this year to remain below the total amount of bond saw in 2015.
"This is because I expect refunding activity to remain strong, even if interest rates rise slightly and because I expect new money issuance to remain close to recent years. I expect new money issuance would definitely remain below the pace sold between 2001 and 2010," said Kozlik.
"As rates gradually rise, it's likely the rest of this year will look similar to the second half of last year," Mauro said. "There was so much uncertainty last year in regards to rates and you saw people held back and this year, there might even be more uncertainty.
The Federal Open Market Committee is scheduled to meet on June 14 and 15 on whether they will raise rates or hold. "Who knows what the Fed week will bring," said Mauro. Janet Yellen, the Fed chair, said Friday that that the Fed will raise rates "probably in the coming months."
Combined new-money and refunding issuance dropped by 15.8% in May to $7.69 billion from $9.14 billion.
Issuance of revenue bonds increased 27.1% to $25.69 billion, while general obligation bond sales declined 16.2% to $13.94 billion.
Negotiated deals were higher by 25.7% to $30.67 billion, while competitive sales decreased by 9.6% to $8.68 billion.
Private placements plummeted 90.3% to $275 million from $2.84 billion.
Taxable bond volume was 39.4% lower at $1.27 billion, while tax-exempt issuance declined by 0.2% to $33.83 billion.
Minimum tax bonds issuance skyrocketed to $4.53 billion from $883 million.
Bond insurance slipped 3.2% in May, as the volume of deals wrapped with insurance declined to $2.49 billion in 168 deals from $2.58 billion in 175 deals.
Variable-rate short put bonds dropped 26.3% to $920 million from $1.25 billion. Variable-rate long or no put bonds shot up to $857 million from $240 million.
Bank qualified bonds were little changed, increasing 0.2% to $2.07 billion.
The sectors were split evenly, as issuance increased in five categories and declined in five. Development issuance decreased 69.8% to $367 million from $1.22 billion. Electric power sales decreased 54.4% to $1.07 billion from $2.35 billion and public facilities transactions declined by 33.9% to $597 million from $902 million.
Transportation transactions almost quadrupled to $9.20 billion from $2.42 billion, environmental facilities deals more than doubled to $357 million from $152 million and utilities advanced 12% to $4.87 billion from $4.35 billion.
As far as the different entities that issue bonds, all saw negative year over year changes except state agencies, local authorities and direct issuers. State agencies produced a 50.5% improvement to $12.98 billion from $8.63 billion, while local authorities deals increased 86.9% to $9.28 billion from $4.97 billion.
The others saw a minimum loss of 8.5%, with the most notable drop coming from state governments, which fell 59.5% to $1.16 billion from $2.87 billion.
California remained the top issuer among states so far this year, followed by Texas, New York, Florida and Illinois.
The Golden State so far this year has issued $26.76 billion, giving it a comfortable lead over the Lone Star State, which has issued $23.25 billion. The Empire State follows with $18.41 billion, followed by the Sunshine State with $7.91 billion. The Prairie State surpassed the Keystone State to join the top five again with $5.98 billion.
There has been talk within the industry of "pent up demand" for infrastructure upgrades, though Kozlik doesn't buy into this argument for higher new money issuance.
"The current level of new money issuance is being partially driven by what I am seeing on the credit landscape. There is a new fiscal reality that state and local governments are dealing with, as revenues are not rising as fast as they have in the past and expenditure demand is rising faster than in the past," said Kozlik.
Kozlik also noted that one of the tactics issuers can use to try to balance this new fiscal reality is to not sell or to put off the sale of new money debt.
"I could raise my issuance expectation if one of two things occur: 1. overall economic growth drives higher or 2. Additional revenues are identified as a method to fund or support higher issuance," he said.


