Long-term municipal bond issuance increased for the fifth month in a row as volume increased 39.9% in December, jumping to $37.83 billion from $27.04 billion a year ago.
The gain pushed total issuance for 2014 to $333.32 billion, just shy of 2013's total volume of $333.85 billion.
December's total volume, which was the highest for the month of December since 2010's $42.05 billion, also surpassed November's total of $28.931 billion, an increase of roughly 23.5%.
"But year-end volume (in 2010) was skewed by the expiration of the Build America Bond Program," said Chris Mauro, head of municipals strategy at RBC, "making December 2015's total all the more impressive."
Sean Carney, director and municipal strategist at BlackRock, said that historically December is thought of a quiet month, but 2014 was much different.
"With the unique calendar this year, giving us essentially another week to make it three full weeks of issuance before any kind of break, issuers took advantage of that as well as rates falling," Carney said. "Ratios looked more attractive and they used that window to bring issuance to market in this calendar year.
Total long-term municipal bond sales totaled $333.32 billion this year, compared to $333.85 billion in 2013, down just 2% from last year. The total volume far exceeded everyone's expectations, as most experts believed volume was in for a precipitous drop from 2013.
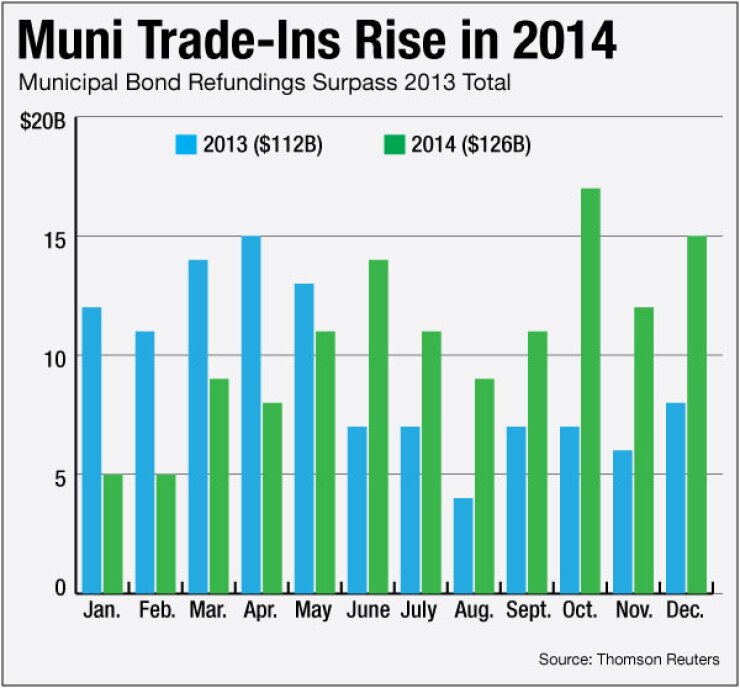
Much of the reason for this outperformance has been the refunding market, which has accelerated in the second half of the year. Refundings continued jumping through the roof in December, up 84.5% from December 2013, totaling $15.21 billion this month compared to $8.25 billion a year ago. This comes on the heels of November refundings outpacing 2013 by 92%.
Municipal refundings closed out the year totaling $125.12 billion, beating the2013 total of $111.46 billion by 12.3%. It is also the second highest total of refundings since 2005.
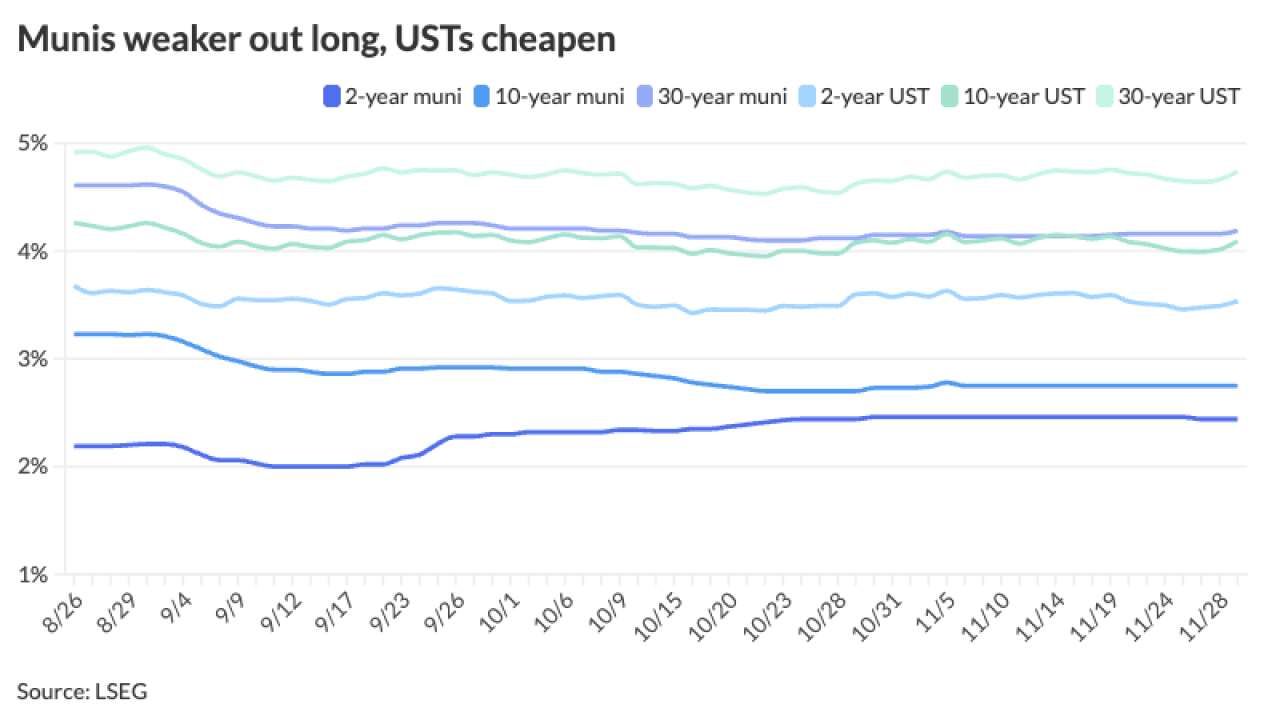
"We had a nice back-down in rates during the first two weeks of December with the 10-year Municipal Market Data rallying 12 basis points and the 30-year 16 basis points," Mauro said. "This helped to generate the outsized refunding volume we saw in the month. As a result, December punched well above its weight this year, accounting for about 11.5% of the year's issuance vs. its long term average of 8.3%."
New-issue supply dropped to $13.07 billion as 495 deals came to market this month, compared to $17.53 billion in 537 deals in December of 2013, a decrease of 25.5%.
"New-money issuance has not increased at a pace that you think it traditionally would this far removed from the recession," said Carney.
Mauro also noted that December's refunding activity bodes well for issuance in early 2015, as rates are expected to remain low during this period. "However, the relatively weak new-money issuance in the month may portend lower than expected issuance in the second half of 2015 if rates rise as currently projected," he said.
Tax-exempt volume increased 49.4% in December to $34.103 billion in 917 deals, compared to $22.83 billion in 726 deals in the same period last year. Taxable sales declined 35.9% to $2.43 billion in 79 deals from $3.79 billion in 102 sales in December 2013.
Negotiated sales rose 53.1% to $29.69 billion in 645 deals from $19.28 billion in 477 deals in December 2013. Competitive sales increased 32.8% to $6.26 billion from $4.72 billion in the same period last year. Private placements plunged once again this month, by 35.8% to $1.88 billion in 50 deals from $2.93 billion in 124 deals in December 2013.
General obligation bond sales shot up 74.6% this month to $13.56 billion in 590 issues from $7.76 billion in 471 issues in December 2013. Revenue bond issuance rose 26% to $24.28 billion in 415 issues from $19.28 billion in 366 issues a year earlier.
Public facilities bonds showed the biggest gain of the month, rising 275.6% to $1.32 billion in 34 issues from $352 million in 36 issues last year. Education showed a big gain as well, increasing 126% percent to $9.39 billion in 386 issues from $4.16 billion in 287 issues in the same period last year. Also logging a big gain was utilities, which increased 163% to $4.22 billion in 125 issues from $1.60 billion in 78 issues in December 2013. The biggest losers were development bonds, which dropped 21.1% to $664 million in 38 issues from $841 million in 36 issues in December 2013; and general purpose bonds which fell 12.4% to $6.39 billion in 255 issues from $7.29 billion in 222 issues in December 2013.
For the year, California ranked as the top state in long-term municipal issuance with sales of $46.59 billion, staying in the top spot despite being down 5.1% from last year's $49.11 billion. Texas moved up to the second spot, up from third in 2013 with $40.79 billion of 2014 issuance, a 25.2% increase from $32.58 billion in 2013. New York dropped one spot to number three with $37.05 billion of new supply this year compared with $41.04 billion last year, a decrease of 9.7%. On the other end of the spectrum, Montana issuance dropped 44.9% to $334 million from $606 million in 2013. Wyoming had an increase of 50.8% but still finished in 51st, totaling $411.2 million compared with $273 million in 2013.


