Municipal traders and managers said the tax-exempt market’s early strength translated into weakness before the end of trading — due to taxable and overseas influences.
“The municipal market had some footing early this morning, but has since weakened a bit as Treasuries sold off,” Michael Pietronico, president of Miller Tabak Asset Management, said. “Traders look to still be in distribution mode and buyers are more selective as supply continues to mount."
Others agreed on the wavering tone of the market Thursday.
“The market opened up strong as a result of the ECB decision to lower rates, but the market gave up early morning gains and is now off on the day,” a New York trader said before the market close.
He said the 30-year auction was weaker than expected contributing to overall market weakness, adding that municipal were off two to four basis points throughout the curve.
“There were some Cal GO trades weaker by four basis points, but no major new-issues today,” he said. However reviewing the week he said new deals that priced earlier did “fairly well.”
He said the competitive $755 million Washington State general obligation bonds from earlier in the week “still seems to have reasonable float.”
Primary market
JP Morgan priced the remarketing for Parish of St. John the Baptist, Louisiana (Baa3/BBB/BBB) $600 million revenue refunding non alternative minimum tax bonds for the Marathon Oil Corp. project.
Bank of America received the written award on Long Island Power Authority's (A2/A/A) $502.425 million of electric system general revenue bonds.
Goldman Sachs priced Alabama Incentives Financing Authority's (Aa3/A / ) $131.47 million of special obligation refunding subordinate taxable bonds on Thursday. The deal carries the previously mentioned ratings, with the exceptions of the 2030 through 2042 maturities totaling $124.255 million that are insured by Assured Guaranty and rated A2 by Moody's and AA by S&P.
Low interest rates contributed to a surge in August municipal issuance of $38.53 billion, with about a third of that issuance in the form of refundings, as issuers took advantage of the rate environment, according to Whitney Fitts, portfolio manager and research analyst, at Appleton Partners Inc. Fitts added that technicals are still favorable, with issuance flat vs. 2018 prior to August’s spike, while demand remains extremely high. As expected, the market digested recently increased issuance well.
“While the municipal curve’s movements generally correlate with those of Treasuries, it is still very much subject to its own supply/demand dynamics,” Fitts said. “The easiest way to look at the relationship between the two is through the muni/Treasury yield ratio. Over the past 2 months, AAA 10-year municipals have become somewhat cheaper with respect to the same maturity Treasuries, as the muni/Treasury yield ratio has increased to 81.33% in the face of plummeting Treasury yields. As we’ve previously noted, the ratio had been as low as 70.85% in May.”
She added that retail continues to drive the municipal market and year-to-date net positive mutual flows have reached $62.7 billion.
“However, growth in foreign ownership over recent years has also been noteworthy.” She said, noting that according to Federal Reserve data, non-US buyers hold more than $100 billion of municipal securities, much of it in taxable issues.
“This is double the level of a decade ago, a trend influenced by nearly $17 trillion in negative yielding sovereign debt and an accompanying desire among foreign investors for income and credit stability.”
Thursday's bond sales
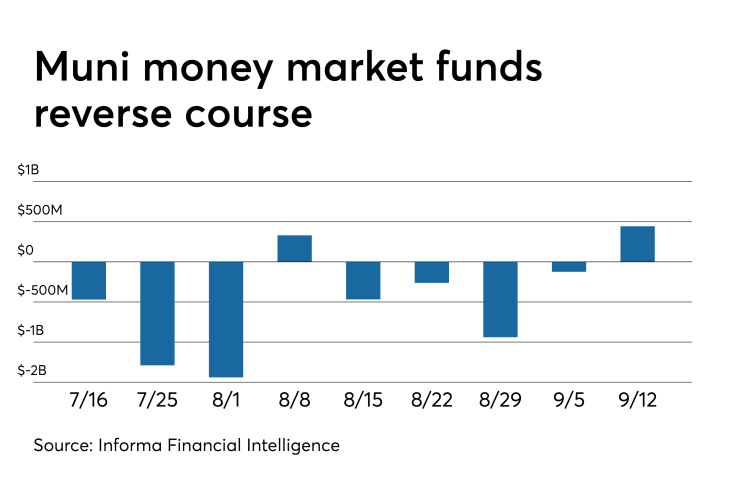
Muni money market funds see inflows for first time in five weeks
Tax-exempt municipal money market fund assets gained by $443.5 million, bringing total net assets to $135.07 billion in the week ended Sept. 9, according to the Money Fund Report, a publication of Informa Financial Intelligence.

The average seven-day simple yield for the 191 tax-free and municipal money-market funds fell to 0.91% from 0.97% from the previous week.
Taxable money-fund assets increased by $24.12 billion in the week ended Sept. 10, bringing total net assets to $3.220 trillion, the thirteenth consecutive week that the taxable total has reached or exceeded $3 trillion.
The average, seven-day simple yield for the 807 taxable reporting funds slipped to 1.75% from 1.76% the prior week.
Overall, the combined total net assets of the 998 reporting money funds rose by $24.57 billion to $3.355 trillion in the week ended Sept. 10.
Muni CUSIP volume increases 9.2% in August
Municipal volumes increased in August, following a decline in July, according to CUSIP Global Services, which is run by S&P Market Intelligence. CUSIP Issuance Trends report tracks the issuance of new security identifiers as an early indicator of debt and capital markets activity over the next quarter.
The aggregate total of identifier requests for new municipal securities — including municipal bonds, long-term and short-term notes, and commercial paper — increased 9.2% July 2019 through August. On a year-to-date basis, total municipal CUSIP request volume was up 10.0% in August. Among top state issuers, Texas, New York and California were the most active in August.
Total CUSIP requests for municipal offerings increased to 1,390 in August 2019. Among leading state activity, CUSIP orders for scheduled public finance offerings from Texas issuers were the most active in August with 174.
Secondary market
Munis were mixed on the

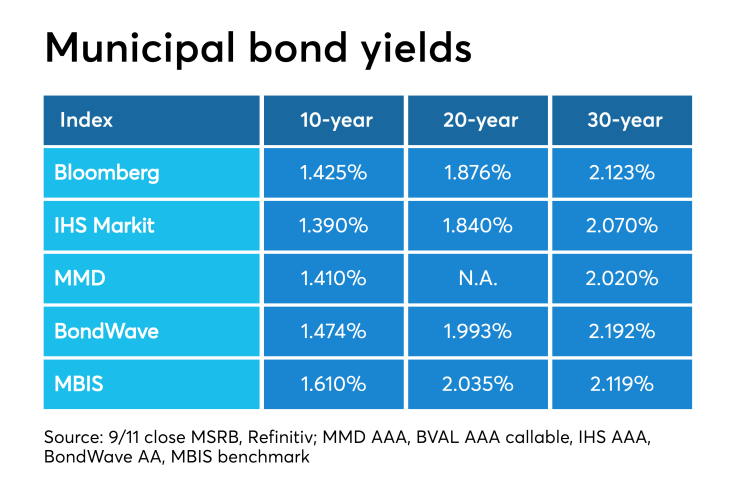
On Refinitiv Municipal Market Data’s AAA benchmark scale, the yield on both the 10-year muni GO and 30-year GO rose slightly to 1.42% and 2.03%, respectively.
The 10-year muni-to-Treasury ratio was calculated at 79.2% while the 30-year muni-to-Treasury ratio stood at 89.8%, according to MMD.
It was all green on Thursday as Treasuries and all stock prices traded higher. The Treasury three-month was yielding 1.951%, the two-year was yielding 1.727%, the five-year was yielding 1.653%, the 10-year was yielding 1.790% and the 30-year was yielding 2.270%.
Previous session's activity
The MSRB reported 34,719 trades Wednesday on volume of $12.77 billion. The 30-day average trade summary showed on a par amount basis of $11.32 million that customers bought $6.05 million, customers sold $3.28 million and interdealer trades totaled $1.99 million.
Texas, California and New York were most traded, with the Lone Star taking 14.615% of the market, the Golden State taking 14.574% and the Empire State taking 10.259%.
The most actively traded security was the State of Texas tax anticipation notes 4s of 2020, which traded 27 times on volume of $66.74 million.
BB40 heads north, while other indexes head south
In the week ended September 12, the weekly average yield to maturity of the Bond Buyer Municipal Bond Index, which is based on 40 long-term bond prices, rose to 3.57% from 3.53% in the previous week.
The Bond Buyer's 20-bond GO Index of 20-year general obligation yields dropped 12 basis points to 2.85% from 2.97% from the week before. It is at its lowest level since Sept. 8, 2016, when it was at 2.83%.
The 11-bond GO Index of higher-grade 11-year GOs fell 12 basis points to 2.39 from 2.51% the previous week. It is at its lowest level since July 14, 2016, when it was at 2.39%.
The Bond Buyer's Revenue Bond Index went south by 12 basis points to 3.33% from 3.45% last week. It is at its lowest level since Sept. 29, 2016, when it was at 3.31%.
The yield on the U.S. Treasury's 10-year note was rose to 1.79% from 1.57%, while the yield on the 30-year Treasury increased to 2.27% from 2.06%.
Treasury auctions 30-years
The Treasury Department auctioned $16 billion of 29-year 11-month bonds with a 2 1/4% coupon at a 2.270% high yield, a price of 99.565627.
The bid-to-cover ratio was 2.22.
Tenders at the high yield were allotted 43.24%.
The median yield was 2.205%. The low yield was 2.000%.
Treasury auctions bills
The Treasury Department Thursday auctioned $50 billion of four-week bills at a 1.940% high yield, a price of 99.849111.
The coupon equivalent was 1.975%. The bid-to-cover ratio was 2.81.
Tenders at the high rate were allotted 69.27%. The median rate was 1.910%. The low rate was 1.880%.
Treasury also auctioned $40 billion of eight-week bills at a 1.920% high yield, a price of 99.701333.
The coupon equivalent was 1.958%. The bid-to-cover ratio was 2.87.
Tenders at the high rate were allotted 47.89%. The median rate was 1.895%. The low rate was 1.870%.
Treasury auctions announced
The Treasury Department announced these auctions:
- $12 billion 9-year 10-month 1/4% TIPs selling on Sept. 19;
- $42 billion 182-day bills selling on Sept. 16; and
- $45 billion 91-day bills selling on Sept. 16.
Gary E. Siegel contributed to this report.
Data appearing in this article from Municipal Bond Information Services, including the MBIS municipal bond index, is available on The Bond Buyer Data Workstation.


