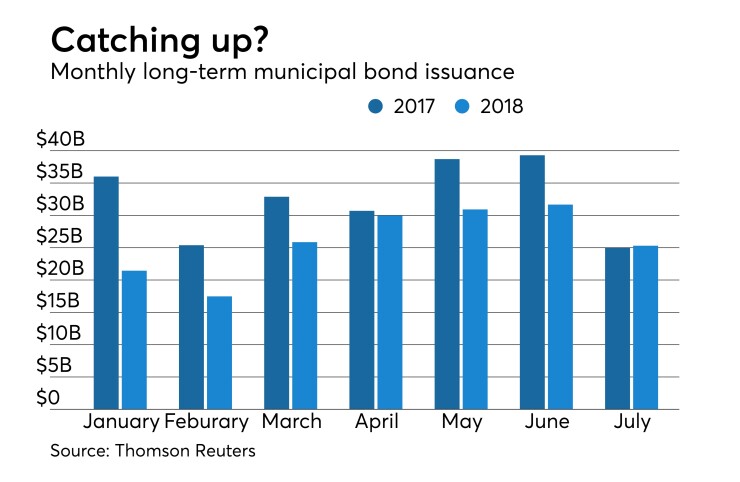
For the first time this year, the municipal bond market generated more volume than it did in the same month in 2017, as July issuance climbed 1.3%.
July 2018 volume inched up to $25.31 billion, from $24.97 billion a year earlier, according to Thomson Reuters data. Issuers completed 610 transactions, off from 733 in July 2017. However, monthly volume fell below $30 billion for the first time since March as summer doldrums took hold.

July's year-over-year gain comes after volume fell 53.5% in January, 36.1% in February, 23.7% in March, 3.9% in April, 20.1% in May, and 19.4% in June, as the market adjusted to a ban on advance refunding bonds under the new tax law.
Even as issuance declined from year-earlier levels, capital improvement issuance has accelerated since the beginning of the year, said Natalie Cohen, managing director at Wells Fargo Securities.
“Without advance refundings most of the borrowing now is for projects, while refundings have receded dramatically,” she said. “New money is up nearly 67% this month over last year; and this is much higher than earlier months following a slow start to the year.”
Some of the decline in volume earlier in the year was a period of absorption following historically heavy December issuance, when market participants thought both private activity bonds and advance refundings would be eliminated.
“This shows up in the Q1 drop of almost 30%," she said. "But in Q2 there was a much smaller drop in borrowing and month to date, some growth.”
New-money issuance in July increased 66.3% to $17.86 billion in 498 deals, from $10.74 billion in 451 deals a year earlier.
“If you take away the comparison from last year, volume numbers are down compared to recent months,” said Dan Heckman, senior fixed-income strategist at U.S. Bank Wealth Management. Volume is thin and investors pre-refunded or called their issues, effectively taking bonds away, making the pie, or number of bonds to potentially buy, smaller, he said.
Heckman said demand has been overwhelming on the short-end, and soon investors will have to readjust and move further out in maturity, making the allocations for all even less of what they have been.
“It has also made the short-end so expensive," he said. "The muni curve has stayed steep compared to Treasury curve, but we think that will change here soon.” .
Refunding volume fell to $4.20 billion in 81 deals, from $8.25 billion in 209 deals a year earlier.
Combined new-money and refunding issuance dropped 45.7% to $3.24 billion, while issuance of revenue bonds rose 15.4% $18.11 billion and general obligation bond sales fell to $7.19 billion from $9.28 billion.
Negotiated deal volume was up to $18.35 billion and competitive sales increased by 2.9% to $6.58 billion.
Taxable bond volume gained to $2.14 billion from $1.62 billion, while tax-exempt issuance increased by 3.2% to $22.46 billion. Minimum tax bond issuance sank to $707 million from $1.59 billion.
“The other interesting thing is growth in taxable offerings – many of the larger deals for higher education and healthcare, with a handful of others (like NYC TFA) selling taxable, either to refund or attract institutional buyers like pension funds, life insurance and foreign investors,” said Cohen.
She added that what she doesn’t think shows up in the numbers is the growth in municipal borrowers using corporate CUSIPs – which is also attracting a similar group of long-end institutional buyers.
Deals wrapped by bond insurance rose 3.8% to $1.29 billion in 88 deals from $1.24 billion in 97 transactions the same time the prior year.
Five of the 10 sectors showed year-over-year increases, as utilities catapulted to $3.31 billion from $1.10 billion, general purpose rose to $6.99 billion from $6.23 billion, public facilities gained to $610 million from $273 billion, health care improved to $2.55 billion from $1.95 billion and electric power increased to $246 million compared to $144 million.
The other five sectors were in the red with the biggest drops coming from transportation, which fell to $2.98 billion from $6.02 billion and environmental facilities, which was at $119 million compared with $235 million.
Three types of issuers were in the green. Colleges and universities was up to $1.10 billion from $244 million, local authorities increased to $4.28 billion from $3.80 billion and state agencies rose to $9.90 billion from $9.40 billion.
California continues to have the most issuance among states so far in 2018. The Golden State has issued $29.62 billion; New York is second with $25.47 billion; Texas is third with $19.43 billion; Pennsylvania is next with $8.90 billion; and New Jersey rounds out the top five with $6.86 billion.


