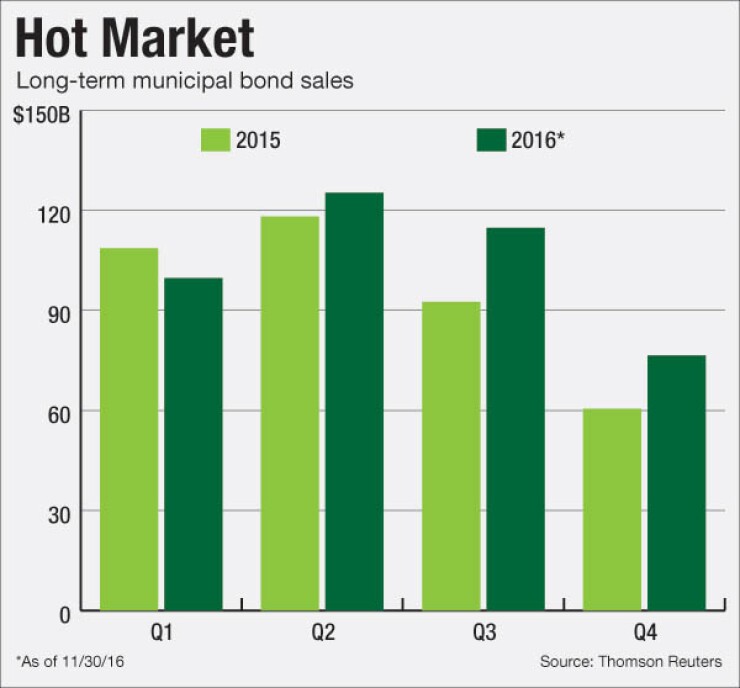

Long-term municipal bond volume remains poised to set an annual record.
Volume dipped 9% in November to $23.87 billion, from $25.39 billion in November of 2015, mostly due to post election shockwaves that hit munis hard, causing yields to balloon. Still, with 11 months down and one to go, year-to-date volume reached $416 billion, meaning $18 billion in December would be enough to surpass 2010's record $433 billion. At this point last year, volume sat at $375.5 billion.
"It will be close, but I would bet that a new record is set," said Alan Schankel, a managing director at Janney Capital Markets. "I did not anticipate [we would see a] record until the middle of our exceptionally busy October, so although I am not surprised now, I would not have projected record volume at mid-year."
After a yearlong series of inflows of investor money into muni funds ended in October, weekly outflows accelerated to a record $3 billion in the week of Nov. 16, according to Lipper FMI. As of Nov. 29, muni yields had climbed as many as 123 basis points from the record lows earlier in the year. Analysts attributed the change to uncertainty over tax policy and the economy after Donald Trump's unexpected victory in the presidential race on Nov. 9.
"The election has driven the market. We have seen the decline in refundings as the curve has steepened," said Scott Andreson, director of municipal research for Seix Investment Advisors. "Issuance is down because of the volatility, and what we have seen post-election is a glimpse at what we will see in 2017."
Refundings, which have been strong for most of the year due to persistent low interest rates, dropped 7.2% to $7.29 billion in 295 transactions, from $7.85 billion in 371 transactions during the same period last year, according to data from Thomson Reuters.
"There will be roughly $40 billion less of bonds that are eligible for refunding next year," Andreson said. "That plus impending interest rate hikes will put a damper on refunding activity."
New money sales decreased 20.7% to $10.17 billion in 447 deals from $12.83 billion in 497 deals, while combined new-money and refunding issuance climbed 36.2% to $6.41 billion from $4.71 billion.
Andreson, who is the secretary of the National Federation of Municipal Analysts, said that although new money was down this month due to continuing rising yields, it won't be down for long.
"New-money issuance is going to increase next year. 2017 will be the year of new issuance rather than refunding, which has been the major story line the past two years," he said.
Negotiated deals, at $18.07 billion, were higher by 2.9%, while competitive sales decreased by 1.5% to $5.61 billion from $5.70 billion.
Issuance of revenue bonds decreased 7.3% to $15.59 billion, while general obligation bond sales dropped 3.3% to $8.29 billion.
Taxable bond volume was 14% higher at $2.07 billion, while tax-exempt issuance declined by 5.2% to $21.28 billion.
Minimum tax bond issuance slipped to $524 million from $1.12 billion, while private placements sank to $192 million from $2.13 billion. Zero coupon bonds increased to $122 million from $66 million.
Bond insurance dropped 10.7% for the month, as the volume of deals wrapped with insurance dipped to $1.84 billion in 138 deals from $2.06 billion in 126 deals.
Six out of the 10 sectors saw year-over-year gains. Utilities increased 23.7% to $3.41 billion from $2.75 billion, development gained 35.4% to $862 million from $637 million, health care rose 17% to $1.86 billion from $1.59 billion and education and electric power saw modest gains of 0.2% and 4.2%, respectively.
The four sectors in the red all saw at least a 6.8% decrease, with housing suffering the biggest drop to $654 million from $1.72 billion.
As for the different types of entities that issue bonds, only three were in the green: districts, colleges and universities, and local authorities. Districts improved 24.9% to $7.08 billion, colleges and universities more than tripled to $897 million from $253 million and local authorities' borrowing was up 1.1% to $4.38 billion from $4.33 billion. On the other end of the spectrum, the other six saw at least a 2.2% decrease, led by state governments, which declined 50.7% to $1.03 billion from $2.09 billion.
California remains the top issuer among states for the year to date, followed by Texas, New York, Pennsylvania and Illinois.
Issuance from the Golden State so far this year has totaled $60.81 billion, with the Lone Star State next at $50.41 billion. The Empire State follows with $41.12 billion. The Keystone State is in fourth with $18.94 billion and The Prairie State rounds out the top five with $17.52 billion.
"Tax reform is front and center, as it has been said that we need a lower and simpler tax code," said Andreson. "Whether that impacts munis it remains to be seen. We would be surprised if there is anything that is passed that takes away issuers' ability to issue tax exempt bonds, we think that corporate tax reform is more likely but nothing is off the table as of now."


