

During the past decade the 5% non-callable 10-year bond structure has become the standard for institutional deals. A coupon levitating far above prevailing rates appeals to both issuers and investors, for very different reasons (see ‘The Allure of 5% Bonds’, The Bond Buyer, Jan. 27, 2012). Due to the popularity of this structure, several vendors provide daily AAA 5% NC-10 curves, and some include additional granularity by state and credit.
These curves have been defective on occasion, as discussed in an earlier article (‘Beware of Bad Benchmark Curves’, The Bond Buyer, Jan. 6, 2016). To avoid arbitrage, the prices of callable benchmark bonds must decline with maturity. But declining prices alone do not guarantee that a curve is valid. In fact, 5% NC-10 curves suffer from another, less obvious, defect. To see this, we need to consider non-callable rates.
Because long-term non-callable bonds are virtually non-existent, muni analysts no doubt spend sleepless nights trying to figure out what optionless rates would look like. Is the 30-year rate closer to 3.00% or 3.50%? Regardless of these speculations, it is a safe bet that their contemplated curves are always smooth.
The callable benchmark curves are also smooth, but should they be so, considering that the 10-year rate is a yield to maturity and the 11-year rate is a yield to call? We can estimate the 11-year optionless rate from the yields of the optionless 5% bonds up to year 10 and the price of the 11-year callable bond. Using a standard interest rate model (e.g. Black-Karasinski) and an assumed volatility, we can iterate the 11-year par optionless rate until it “explains” the price of the 11-year callable bond.
But what volatility is reasonable? The swaption volatility for a like lockout and maturity (here, a swaption on a one-year swap exercisable in 10 years, currently about 36%) is undoubtedly too high. The Commonwealth of Massachusetts (see ‘Mass. Hardens Refunding Guidelines’, The Bond Buyer, April 26, 2013) uses a more reasonable 15% volatility for refunding decisions.
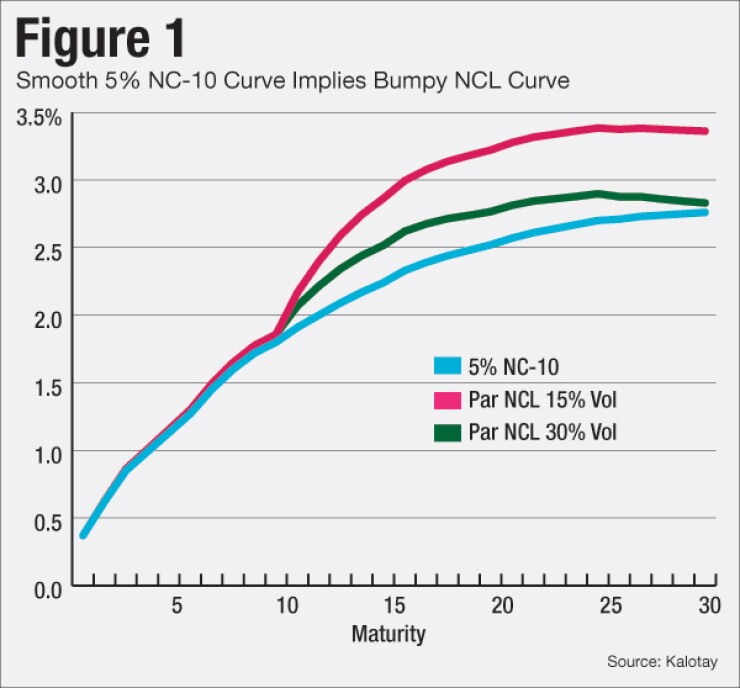
Optionless rates beyond 11-years can be estimated in a similar fashion. Figure 1 below displays a typical 5% NC-10 curve, and the implied optionless (NCL) rates at different volatilities (using Black-Karasinski). The optionless curves have a conspicuous bump after the 10-year point. If the callable curve is smooth, the implied non-callable curve is bumpy. On any given day rates can bounce around, but non-callable curves that are always bumpy strain credulity. Thus, smooth callable curves are not to be trusted!
It is noteworthy that a higher volatility implies lower optionless rates. According to Figure 1, where the YTC is 2.76%, at a 15% volatility the implied optionless 30-year rate is 3.36%, and at a 30% volatility it is 2.83%. Which one is more reasonable?
Let’s now turn our attention to how 5% callable curves are commonly misused. As discussed in a previous article (‘Spread(ing) Confusion’, The Bond Buyer, Nov. 23, 2015), pure discount rates are a prerequisite for rigorous analysis, such as estimating duration, forward rates, or present value savings from refunding. As the following example demonstrates, using a callable curve in its raw form is asking for trouble.
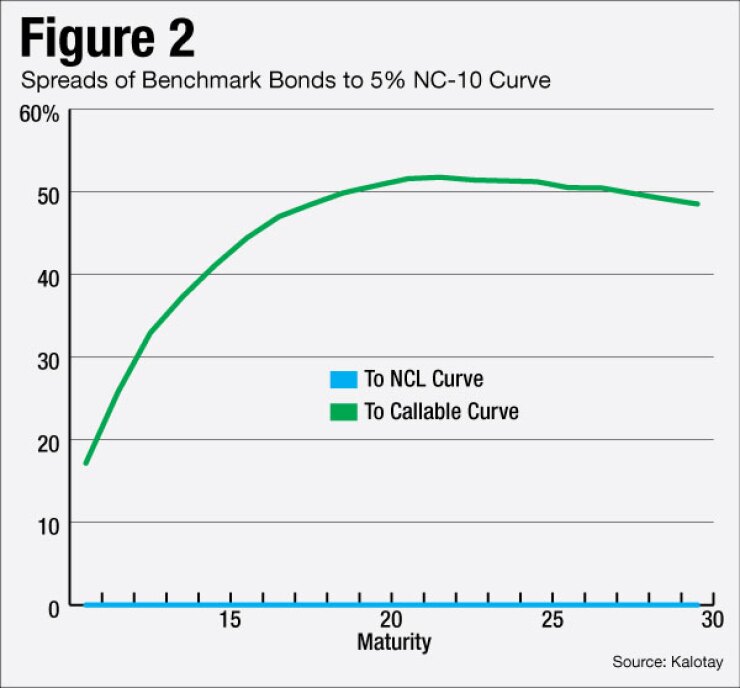
Consider the benchmark bonds whose yields define a 5% NC-10 curve. It is common sense that these bonds should be fairly priced relative to this curve, i.e. their spread to the curve should be 0. However, as shown in Figure 2, the longer-term bonds are priced at large positive spreads to the benchmark curve from Figure 1. How to solve this apparent paradox?
The answer is to first convert the NC-10 curve into an NCL curve, as described above, and then use the NCL curve for the analysis. You may be surprised to discover that the purposes of the spread analysis of benchmark bonds, any reasonable volatility will do. The spreads will be identically zero, indicating that the prices and the optionless curve are in perfect harmony — see the blue line at the bottom of Figure 2. But choosing the right volatility is essential for spread analysis of non-benchmark bonds.
There are two critical takeaways. First, smooth callable curves have an inherent flaw: they imply a bump in optionless rates just past the 10-year point. Second, a callable curve in its raw form should never be used for bond analysis. For sensible results first it must be converted to an optionless curve, using a reasonable volatility.
Andrew Kalotay is president of Andrew Kalotay Associates


