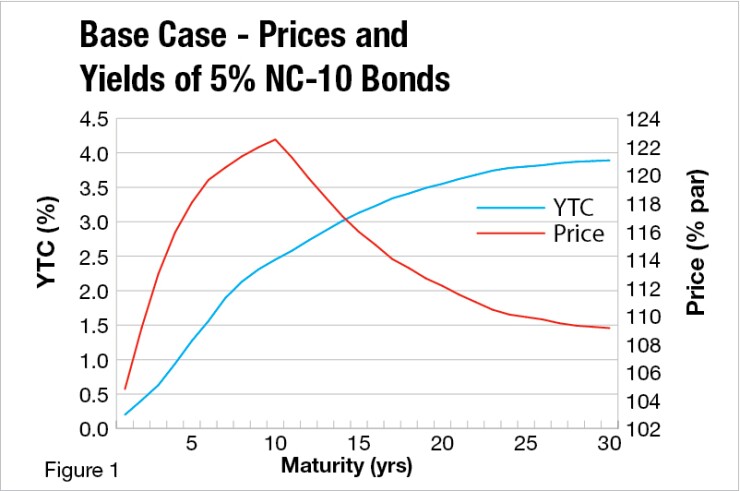


During the past decade the 5% NC-10 structure — that is, 5% bonds callable after 10 years at par — has become the norm for muni bonds in the institutional market. This practice is so prevalent that it serves as the quotation convention for the benchmark Municipal Market Advisors and Municipal Market Data yield curves. Because today AAA-rated 5% bonds trade above par, these benchmark yields are expressed as yields-to-call, or YTCs.
A recent phenomenon is the emergence of bonds with shorter call protection, such as NC-8s and NC-5s as funding alternatives for municipalities.
From their perspective the nearer call date reduces the hurdle to advance-refund qualifying bonds by mitigating the negative arbitrage due to the historically low Treasury rates. However, the shorter call protection also dampens the potential upside for investors, which in turn reduces the price they are willing to pay.
Importantly, shortening the call protection affects the prices of bonds with maturities even less than 10 years, because previously non-callable bonds may become callable. For example, as we will see, the price of a 10-year NC-5 bond will be substantially lower than that of a 10-year bullet.
With length of call protection as a new variable in the mix, municipal issuers and their advisors face the challenge of determining which structure makes the best economic sense. The decision hinges on the break-even price between the alternatives. Needless to say, investors also require such information in order to decide whether to purchase, say, an NC-8 or a like NC- 10.
Figure 1 below shows a recent AAA 5% NC-10 curve and the dollar prices of the corresponding bonds. The prices depend on the complex interaction of the upward-sloping yield curve and the 10-year call provision. The yields of the shorter maturities are quite low, but the 5% coupon is paid only for a limited time. The maximum price, slightly above 122, is attained at the 10-year maturity. Beyond year 10 the prices gradually decline, dropping to 109 in year 30.
Let's turn to the pricing of 5% bonds callable in less than 10 years. Incidentally, the call-protection period could also be extended beyond 10 years, resulting in higher prices. In the extreme case, the bonds could be non-call life, or NC-L.
Figure 2 displays the fair prices of 5% NC-5, NC-10 and NC-L bonds, the last type being included for visual reference. The quantity to note is the difference between the prices of NC-10 and NC-5 bonds of the same maturity. These differences are shown explicitly in Figure 3 for other short calls as well.
These price differences from NC-10 provide break-even points for bonds with shorter calls. For example, in the case of the NC-5 bonds at the 30-year point the indicated difference is roughly 2.0 %, while at the 15-year point it is about 3.4%. The largest difference, 5.4%, occurs at the 10-year point, where the NC-10 is not callable while the NC-5 is.
For this maturity the price decline is about 1% per year of reduced call protection. For longer maturities the effect is less dramatic. For the 30-year maturity, the price difference per year of reduced call protection is about 0.4% — around 2 points for a 30NC-5, as noted above.
Issuers can use the information provided in Figure 3 when deciding whether to sell bonds with shorter call protection or stay with the 10-year call. If the market demands a smaller price reduction than indicated, the bond with the shorter call is good deal.
Needless to say, similar analyses can be performed for weaker credits. The possibility of refunding is of less concern to investors in this case, and therefore the drop in price due to a shorter call is less pronounced.
In other words, the price differences between bonds with different call dates will be smaller than those for the AAA bonds considered above. We also observe that these results need to be updated as market conditions change.
As rates increase and the yield curve flattens, issuers will need the proper analytical tools to make informed funding decisions.
Andrew Kalotay, president of Andrew Kalotay Associates, is a leading authority on institutional debt management and fixed-income valuation.
What's Wrong with Yield-Based Decisions?
It is not uncommon for muni market participants to think in yields rather than prices, and base their borrowing-investment decisions on yield differences.
In the case of 5% premium bonds with different call dates this approach is inappropriate. For a meaningful comparison, the horizons of the alternatives should be the same; comparing YTCs violates this rule.
The price of a premium callable bond depends primarily on the interest rate to the call date, and secondarily on the interest rate to the final maturity.
Consider for example in Figure 2 the 30NC-10 bond (price 109.12, YTC 3.89%) and the 30NC-5 bond (price 107.10, YTC 3.44%). The YTC of the NC-5 bond is significantly lower than that of the NC-10 bond because the 5-year rate is barely over 1%, while the 10-year rate is about 2.50%.
The 55-basis-point difference between the YTCs is heavily influenced by the 1.50% difference between the interest rates corresponding to the respective call dates. In contrast, the 4.56% YTM of the NC-5 bond is 11 basis points higher than the 4.45% YTM of the NC-10 bond — a more meaningful though not particularly helpful comparison.
Price comparison on a break-even basis is the way to go as discussed in this commentary.


