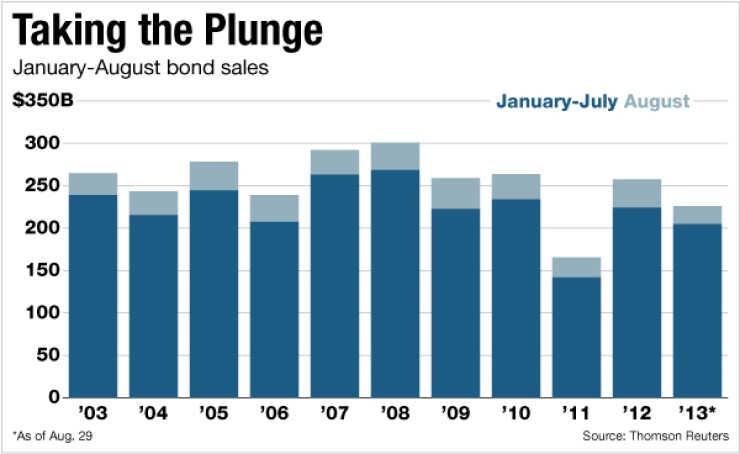
The plunge in long-term municipal bond volume for 2013 continued as issuers in August floated 37.7% less than they did over the same period in 2012, the latest sign that
Municipalities issued $20.9 billion last month in 746 deals, against $33.5 billion in 1,066 issues in August 2012, Thomson Reuters numbers show. For the year to date, new issuance has fallen to $225.9 billion in 7,963 deals from $257.6 billion in 9,005 deals, a decline of 12%.
The demand for refundings that propelled muni volume in 2012 sputtered, as did the appetite for taxable and new money deals that flourished earlier this year.
“The protagonist for August was the drop off in refundings due to the sharp increase in yields the market experienced over the summer,” said Tom Kozlik, municipal credit analyst at Janney Capital Markets. “This refunding issuance drop off is not surprising and the pressure of higher yields, the antagonist for August, could be around for some time.”
Refunding volume has fallen 29% in 2013, to $80.5 billion in 3,246 issues. That compares with $113.3 billion in 4,377 deals through August 2012.
In August, re-financings plunged 77% to $3.4 billion in 164 issues from $15.2 billion in 455 deals one year earlier.
Janney is advising issuers to execute refundings quickly if they make financial sense, Kozlik added, as well as to move up new money issues if the timing works for them.
The market suffers from “refunding exhaustion,” said Gene Gard, co-portfolio manager of the Dupree Municipal Bond Fund Family, in Lexington, Ky. Issuers have taken advantage of lower rates over the last year or two to advance refund many of the obvious candidates for refunding, so not as many refunding opportunities remain.
New-money deals fell 7% last month, to $11.8 billion in 515 issues from $12.6 billion in 506 deals in August 2012. For 2013 through August, they are up 5%.
Taxable issuance, which had been on the rise for much of this year, dropped 48% in August to $1.9 billion in 78 deals from $3.6 billion in 101 issues this time last year. For the year to date, taxable issuance remains 40% higher than through eight months of 2012.
Issuance decreased from a year earlier in most major categories and sectors last month. Among the largest sectors, issuance dropped 36% in education, 58% in health care, 52% in transportation, 53% in utilities and 32% in the general purpose category.
Electric power volume, one bright spot, rose 45% last month against August 2012, to $2.4 billion from $1.7 billion.
Negotiated volume fell 38% last month to $15.2 billion from $24.5 billion a year earlier. Competitive deals dropped 21% in August, to $5.4 billion from $6.8 billion.
Issuers floated 48% less in revenue bonds in August, as volume sank to $12 billion from $23.1 billion a year earlier. General obligation debt issuance fell last month, though by just 15%, to $8.9 billion from $10.4 billion in August 2012.
Fixed-rate issuance fell by 35% last month, to $18.9 billion from $28.9 billion.
Variable-rate short put volume dropped 70% last month, while that for variable-rate long- or no-put declined 26%.
Linked-rate issuance decreased 40% in August. Zero-coupon issuance fell 92% over the same period.
Volume for large state and local issuers dropped in August. State agencies issued 26% less than they did one year earlier, as volume fell to $6.7 billion from almost $9 billion in August 2012.
Volume for cities and towns fell 34%, to $3.9 billion from $5.9 billion. Districts issued 38% less last month than they did in August 2012, with volume dropping to$3.6 billion from $5.8 billion.
Local authorities floated 76% less last month, with$1.6 billion, compared witg $6.6 billion a year earlier.
California led all state issuance in August, moving up one spot from a year earlier on 19% more volume. The Golden State floated $34.23billion in 586 deals last month against $28.9 billion in 509 issues one year earlier.
Issuers in Texas climbed one spot to second place. The Lone Star State issued just 2% more than in August 2012, to $25.4 billion in 978 deals versus almost $25 billion in 925 issues.
New York issuance plunged 43%, still good enough for third place. Issuers in the Empire State floated $18.8 billion in 487 deals against $33.1 billion in 641 deals.
New Jersey jumped to fourth place from 12th on 48% more in issuance. Garden State volume rose to $10.7 billion in 200 deals compared with $7.2 billion in 281 issues in August 2012.
Florida issuers held onto fifth place in August, despite 16% less volume. The Sunshine State floated $9.5 billion in 150 deals, versus $11.4 billion in 162 issues in August 2012.
Just one deal crossed the $1 billion mark last month. On Aug. 8, South Carolina Public Service Authority issued $1.34 billion in new money and refunding taxable and tax-exempt bonds.
The state of Washington floated $867 million in taxable and tax-exempt GOs in a competitive offering one day earlier. On Aug. 20, the New Jersey Transportation Trust Fund Authority issued $849 million in transit bonds.


